On 26 August 2020, DOWs 7 and 8 deployed on Hurricane Laura as it made landfall near the Texas-Louisiana border as a category 4 storm. The story of the deployment was recently featured in the Washington Post (link). Analysis of radar and in situ mesonet data was also recently published in the journal Geophysical Research Letters (Kosiba et al. 2025)
Below is a slideshow of some of our pictures, radar imagery, and wind observations from the mission. For larger image quality, click on the images.
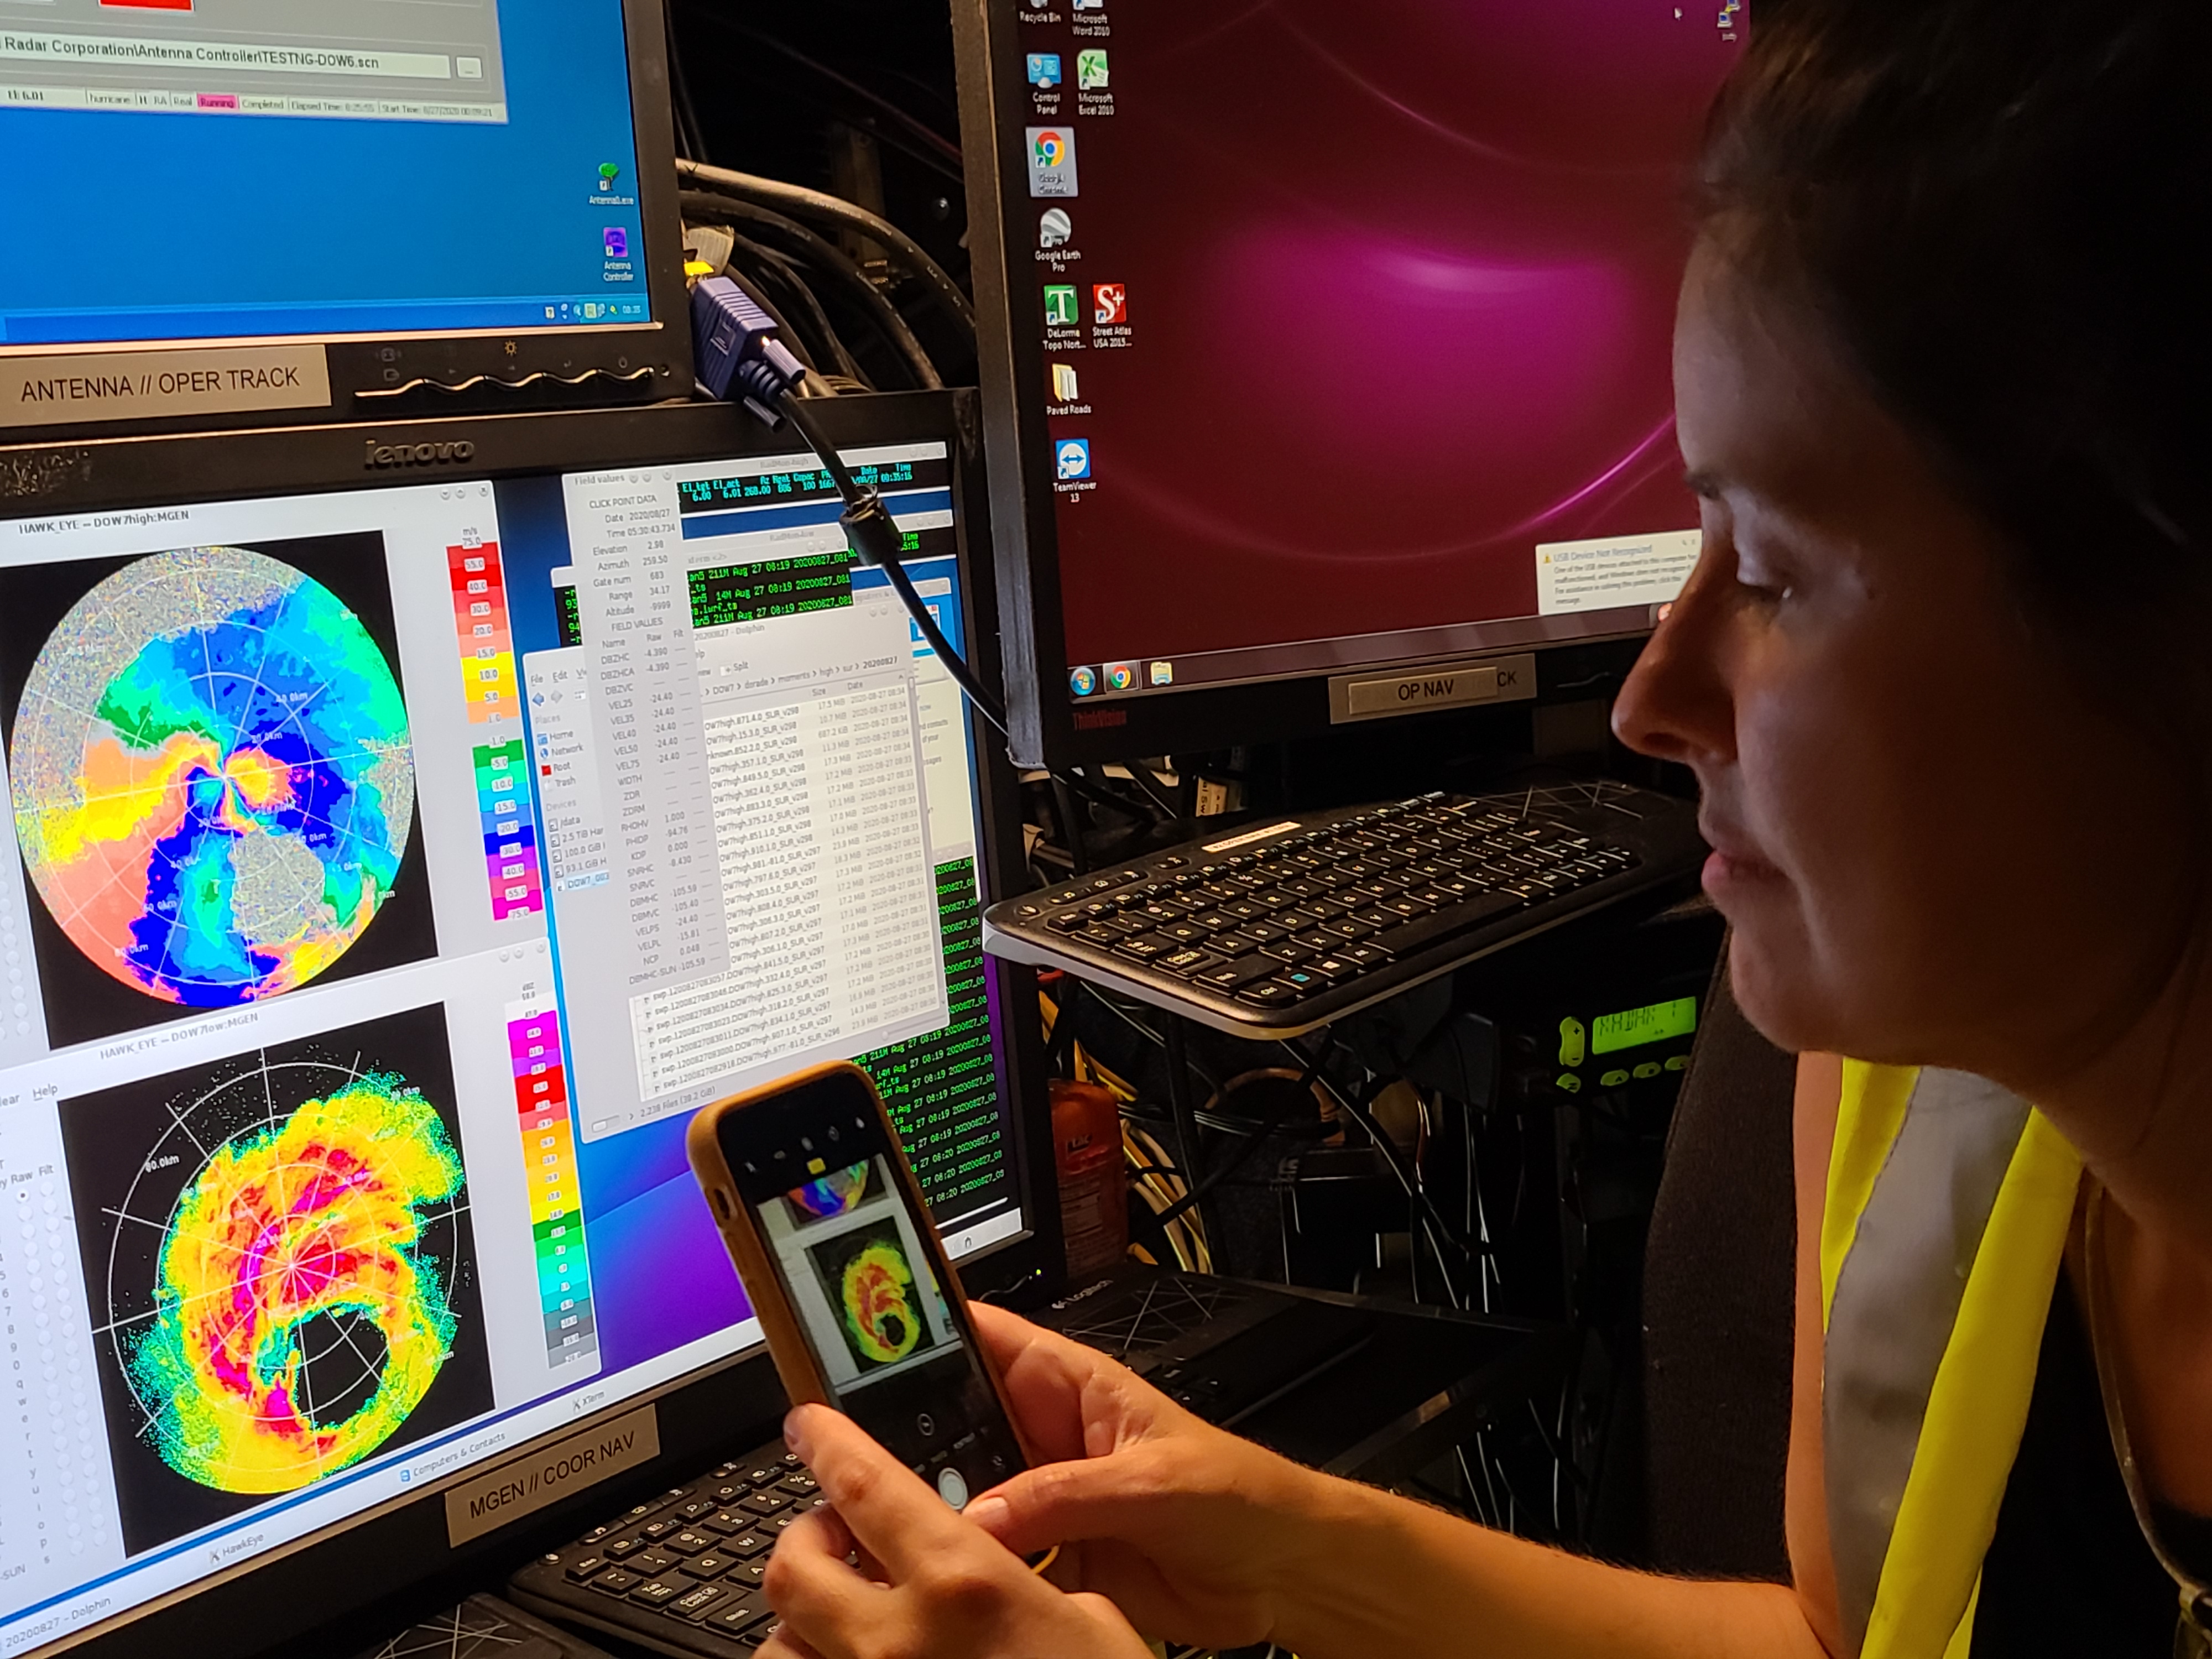
Karen Kosiba takes a picture of the radar display in DOW7.
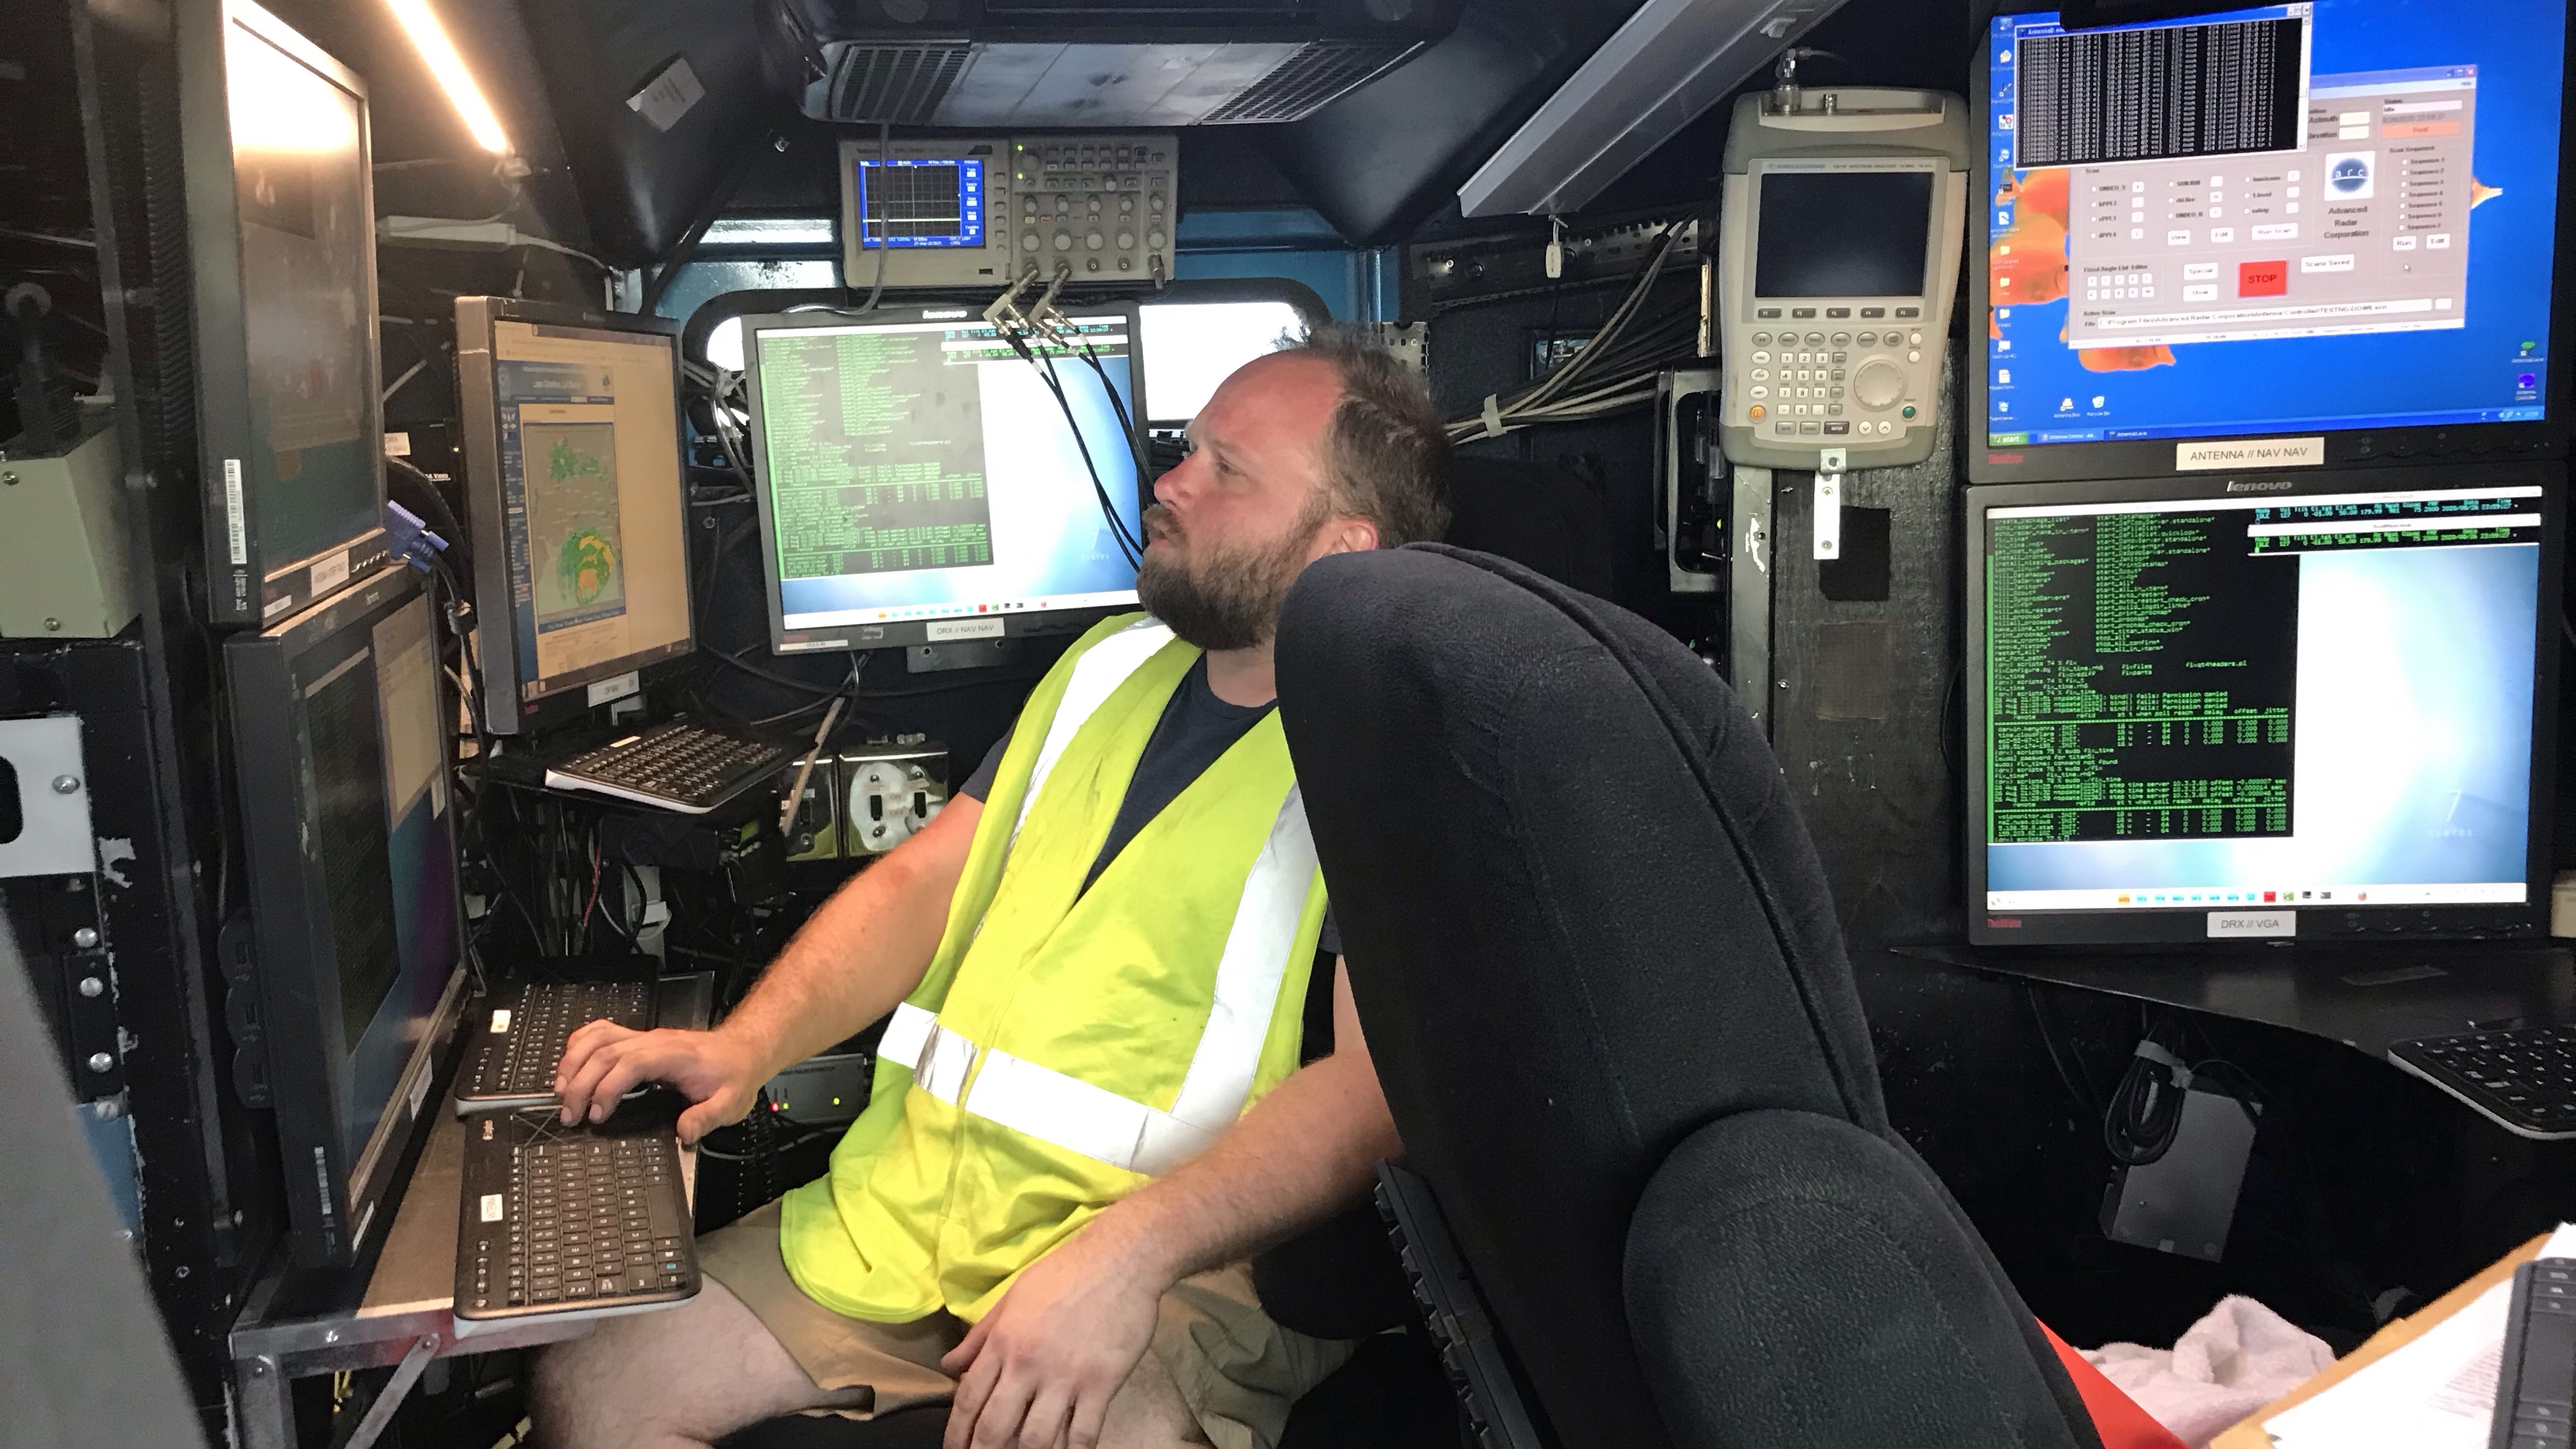
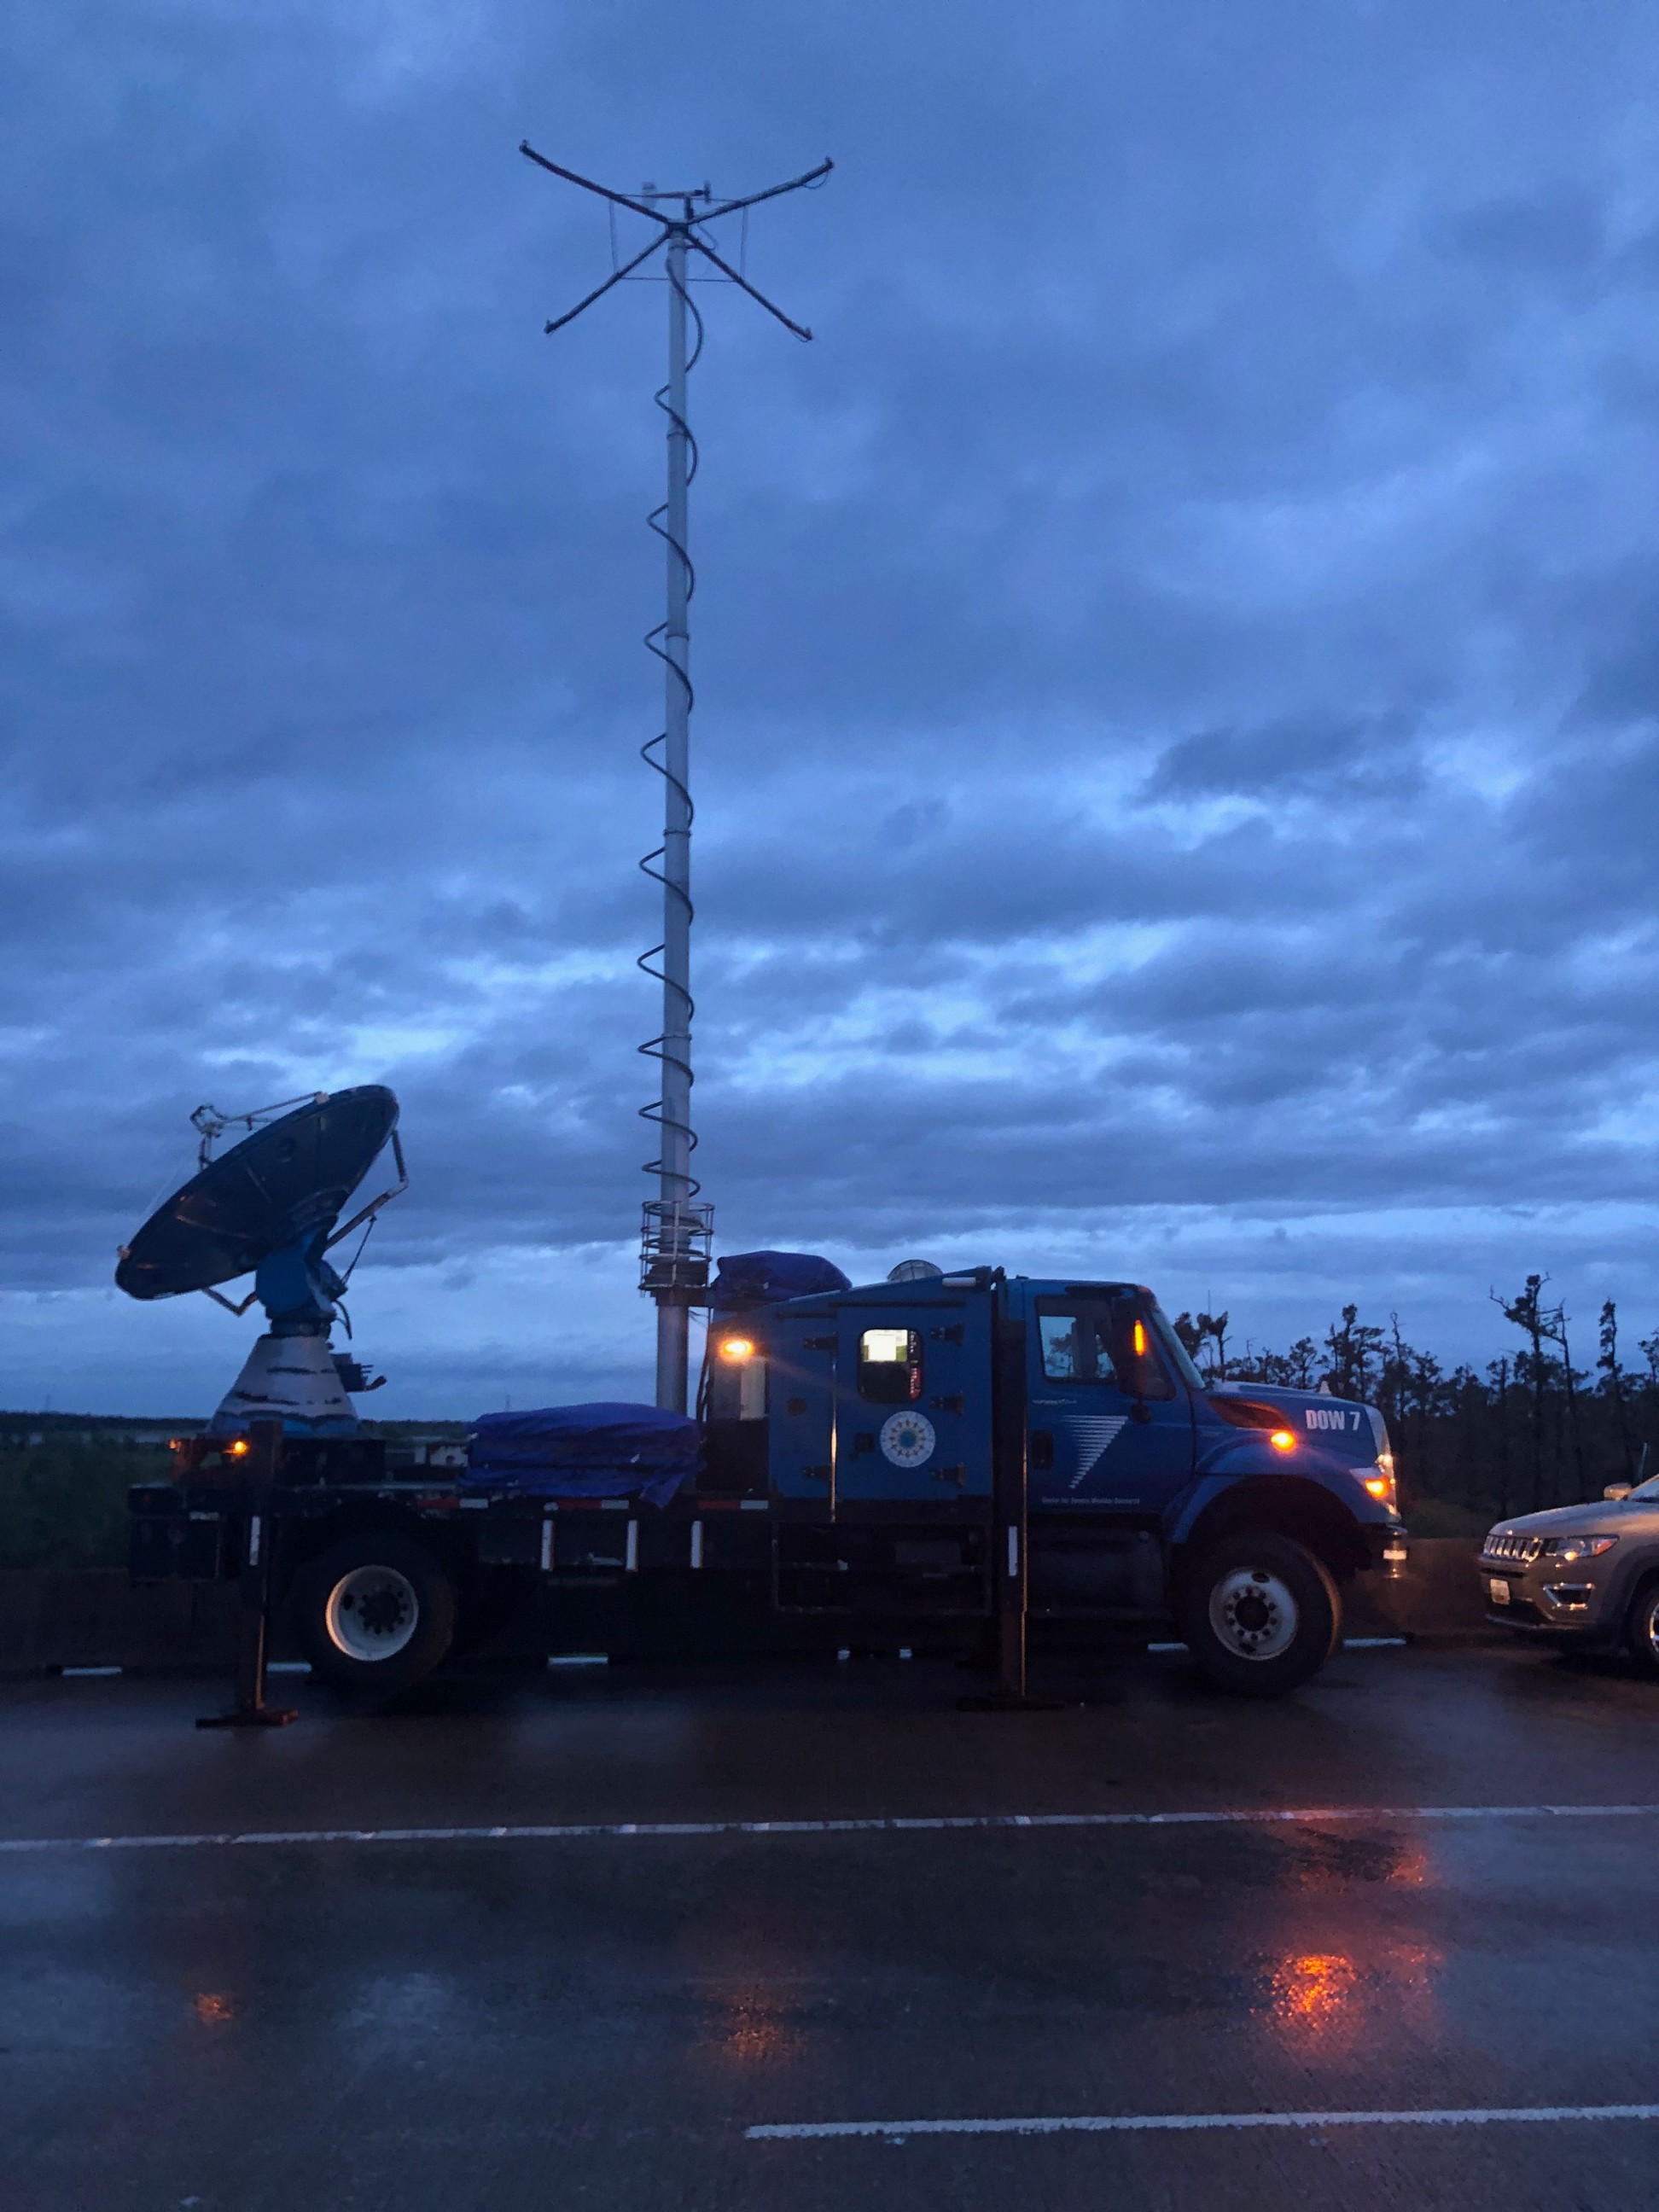
Drew Frambach booting up DOW7 before the hurricane.
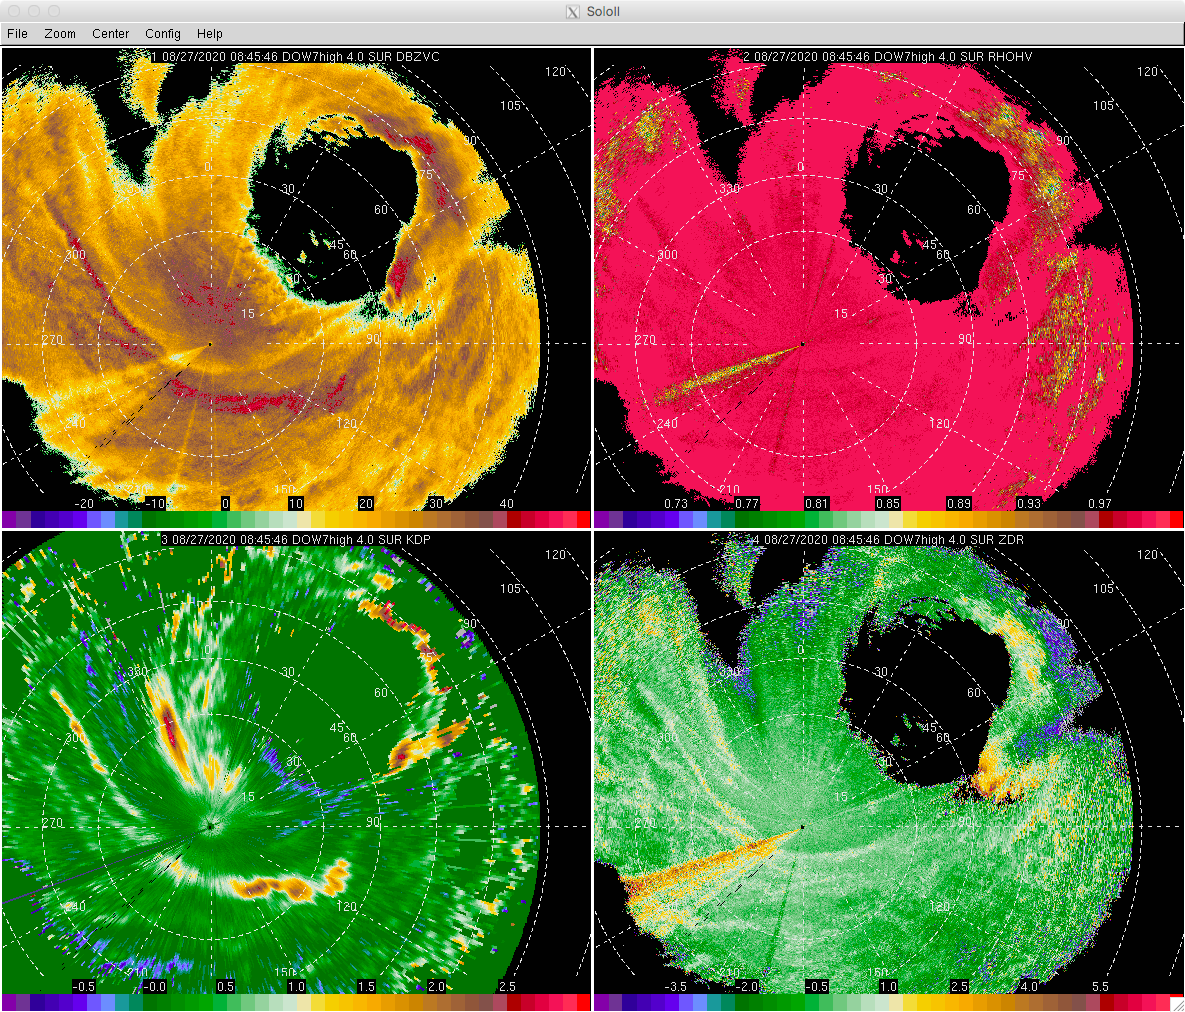
DOW7 Dual-pol fields in the eyewall and inner rainband. Top-left is reflectivity; Top-right is Rho-Hv; Bottom-left is KDP; Bottom-right is ZDR (offset not applied).
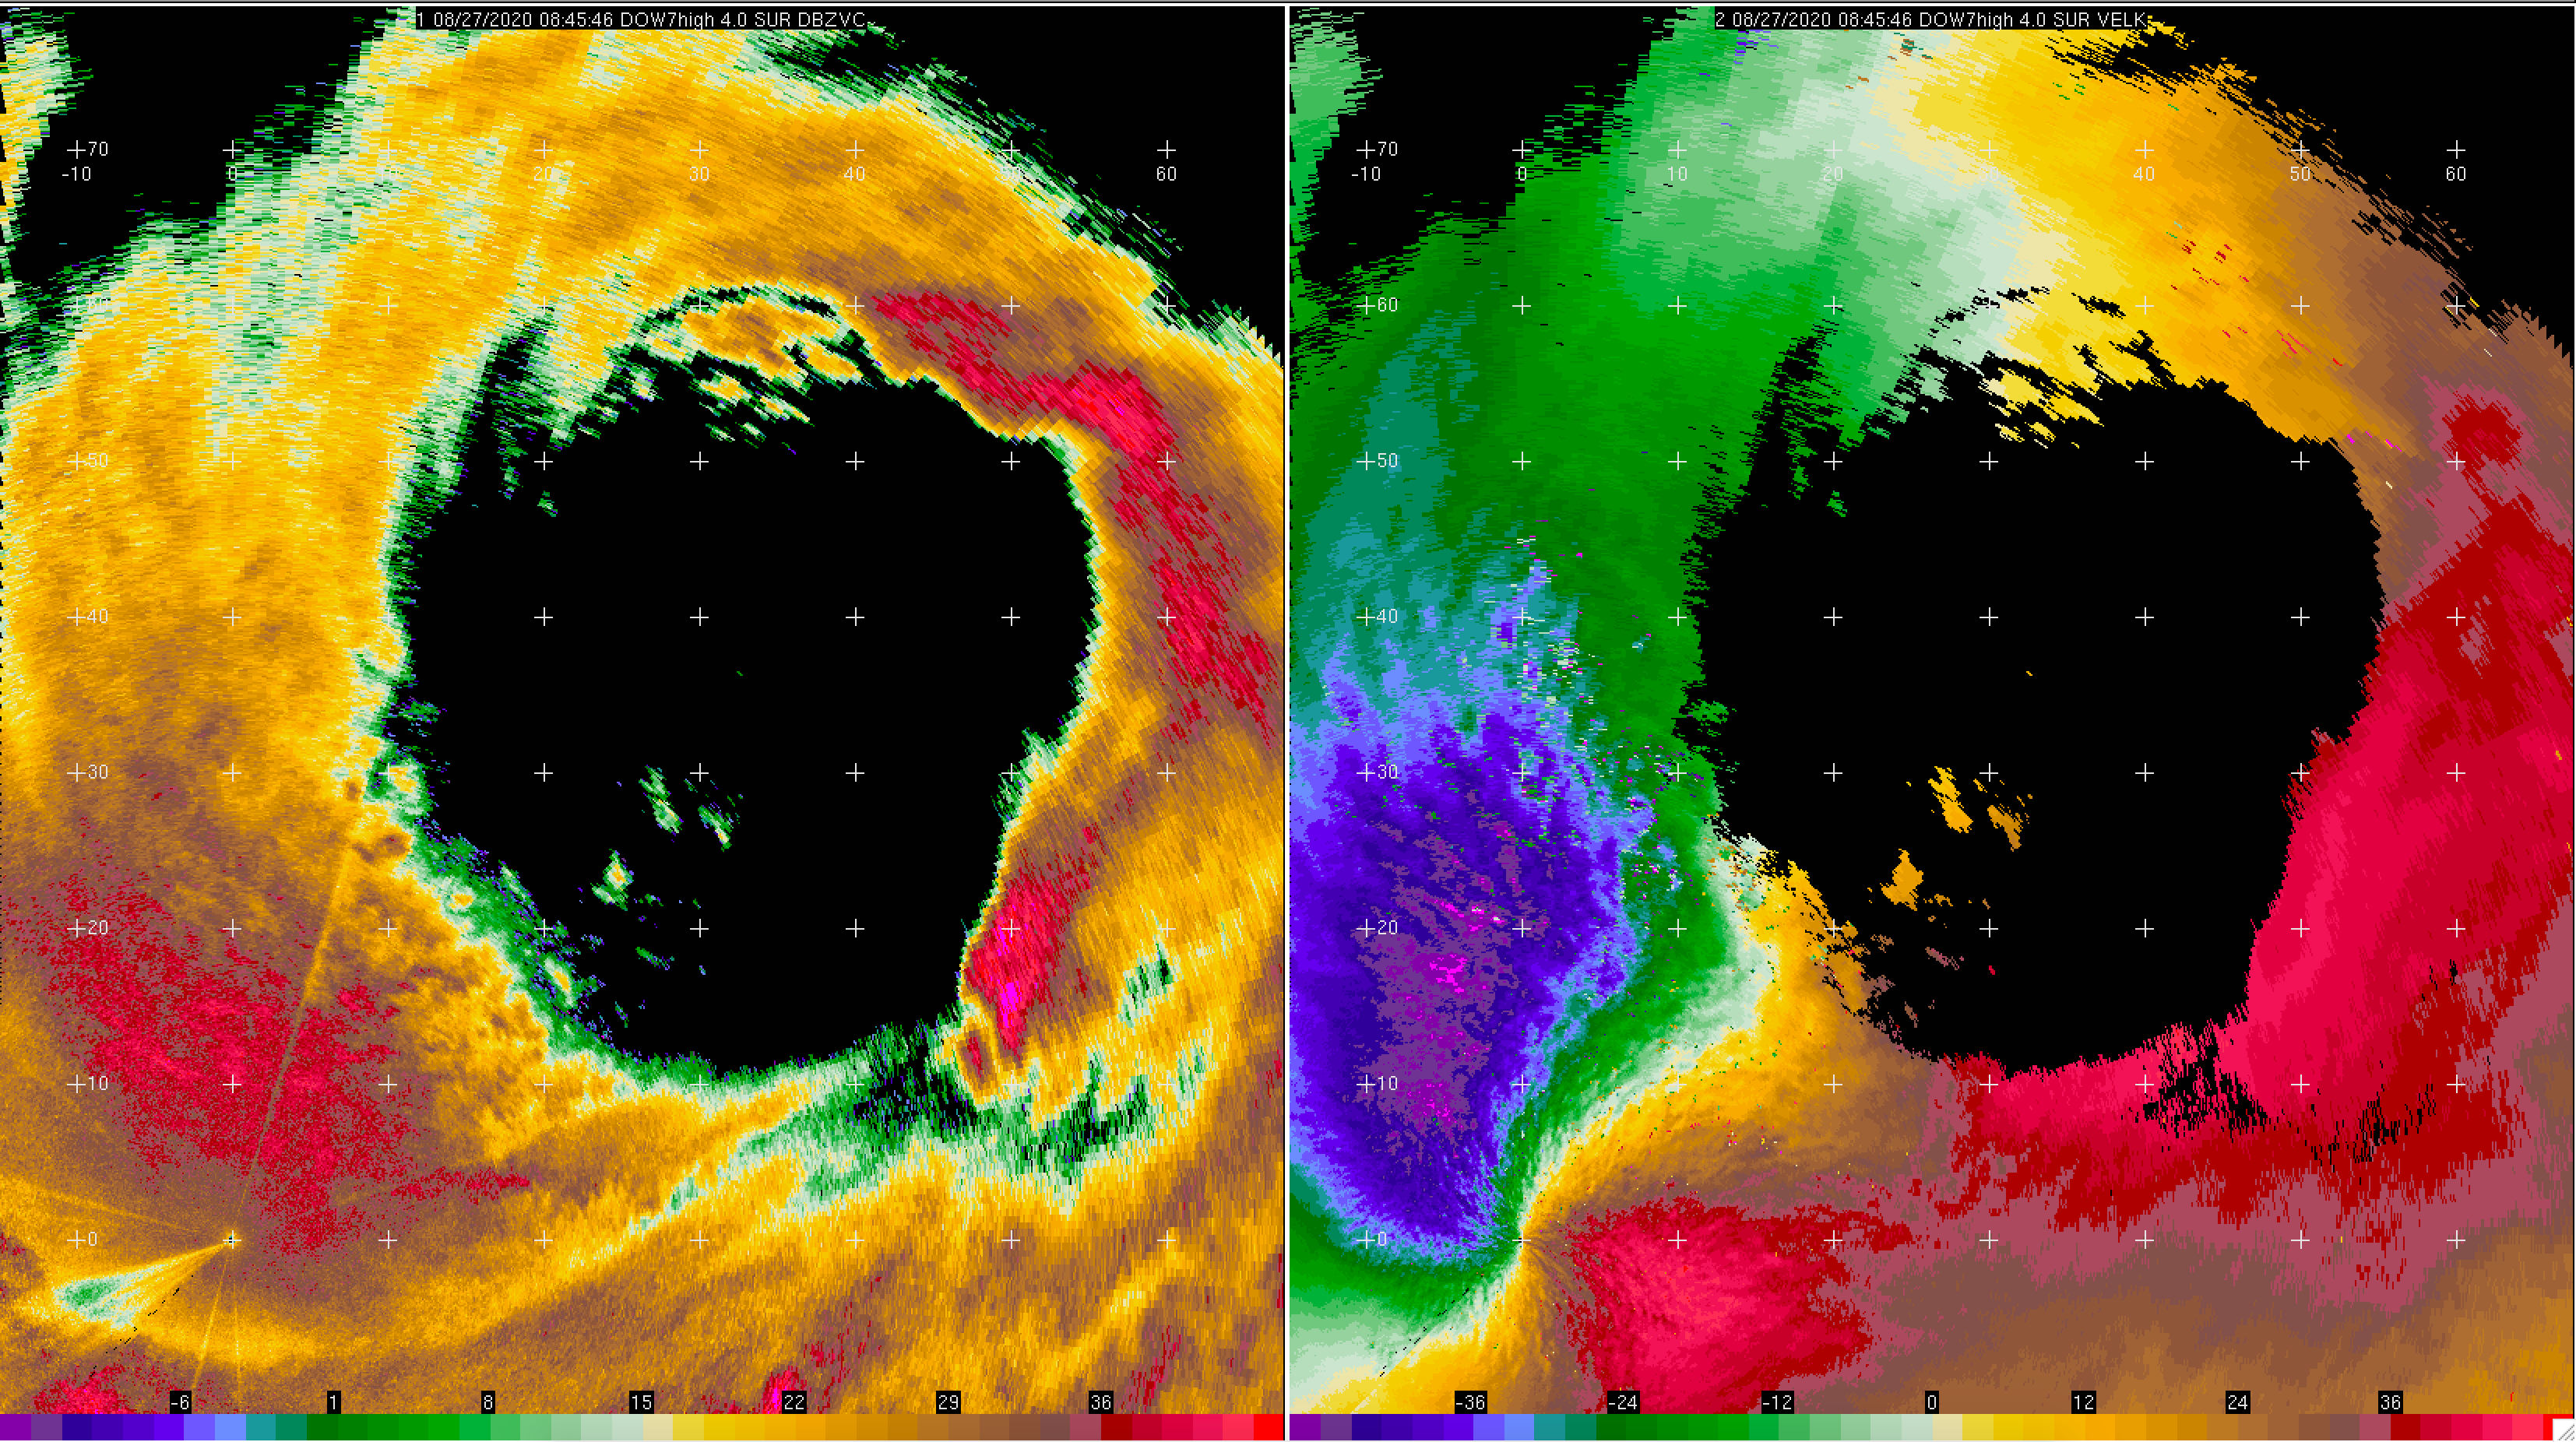
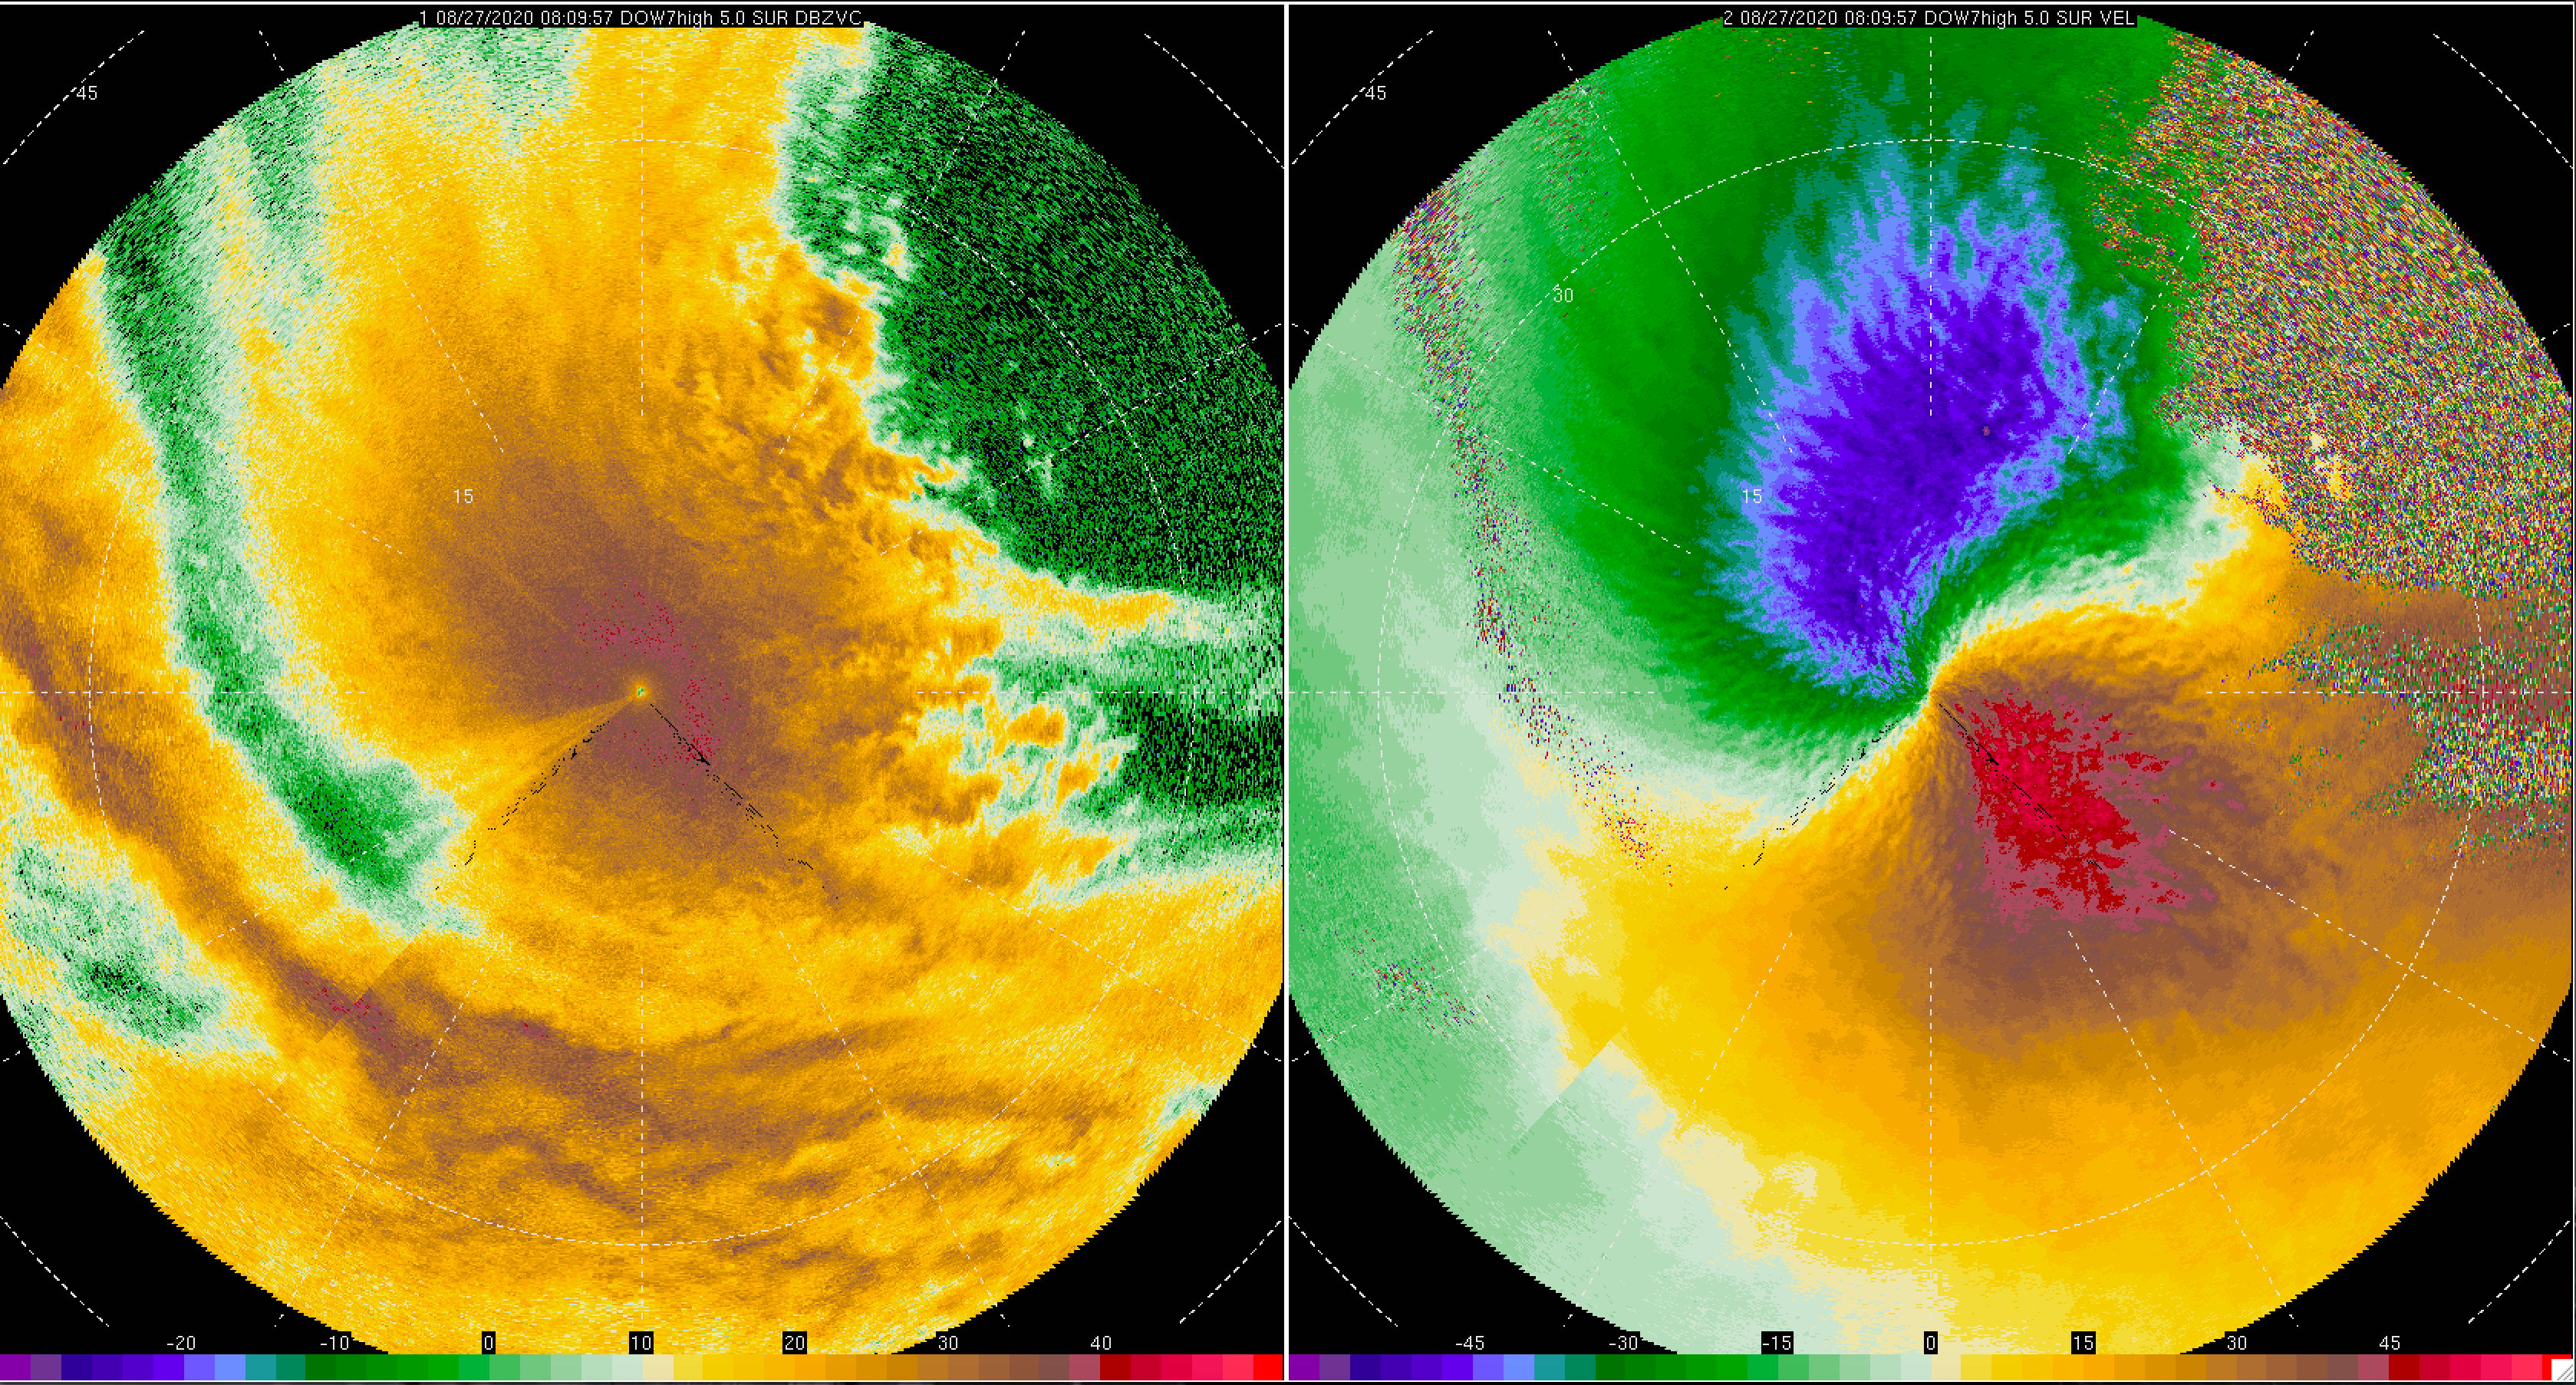
Eye moving away from Lake Charles, as seen by DOW7. Left panel is reflectivity; Right panel is Doppler velocity in m/s.
Eye moving away from Lake Charles. Inner eyewall ~15 km to the northeast. Note the finescale structures along the inner edge of the eyewall. Left panel is DOW7 reflectivity; Right panel is DOW7 Doppler velocity in m/s.
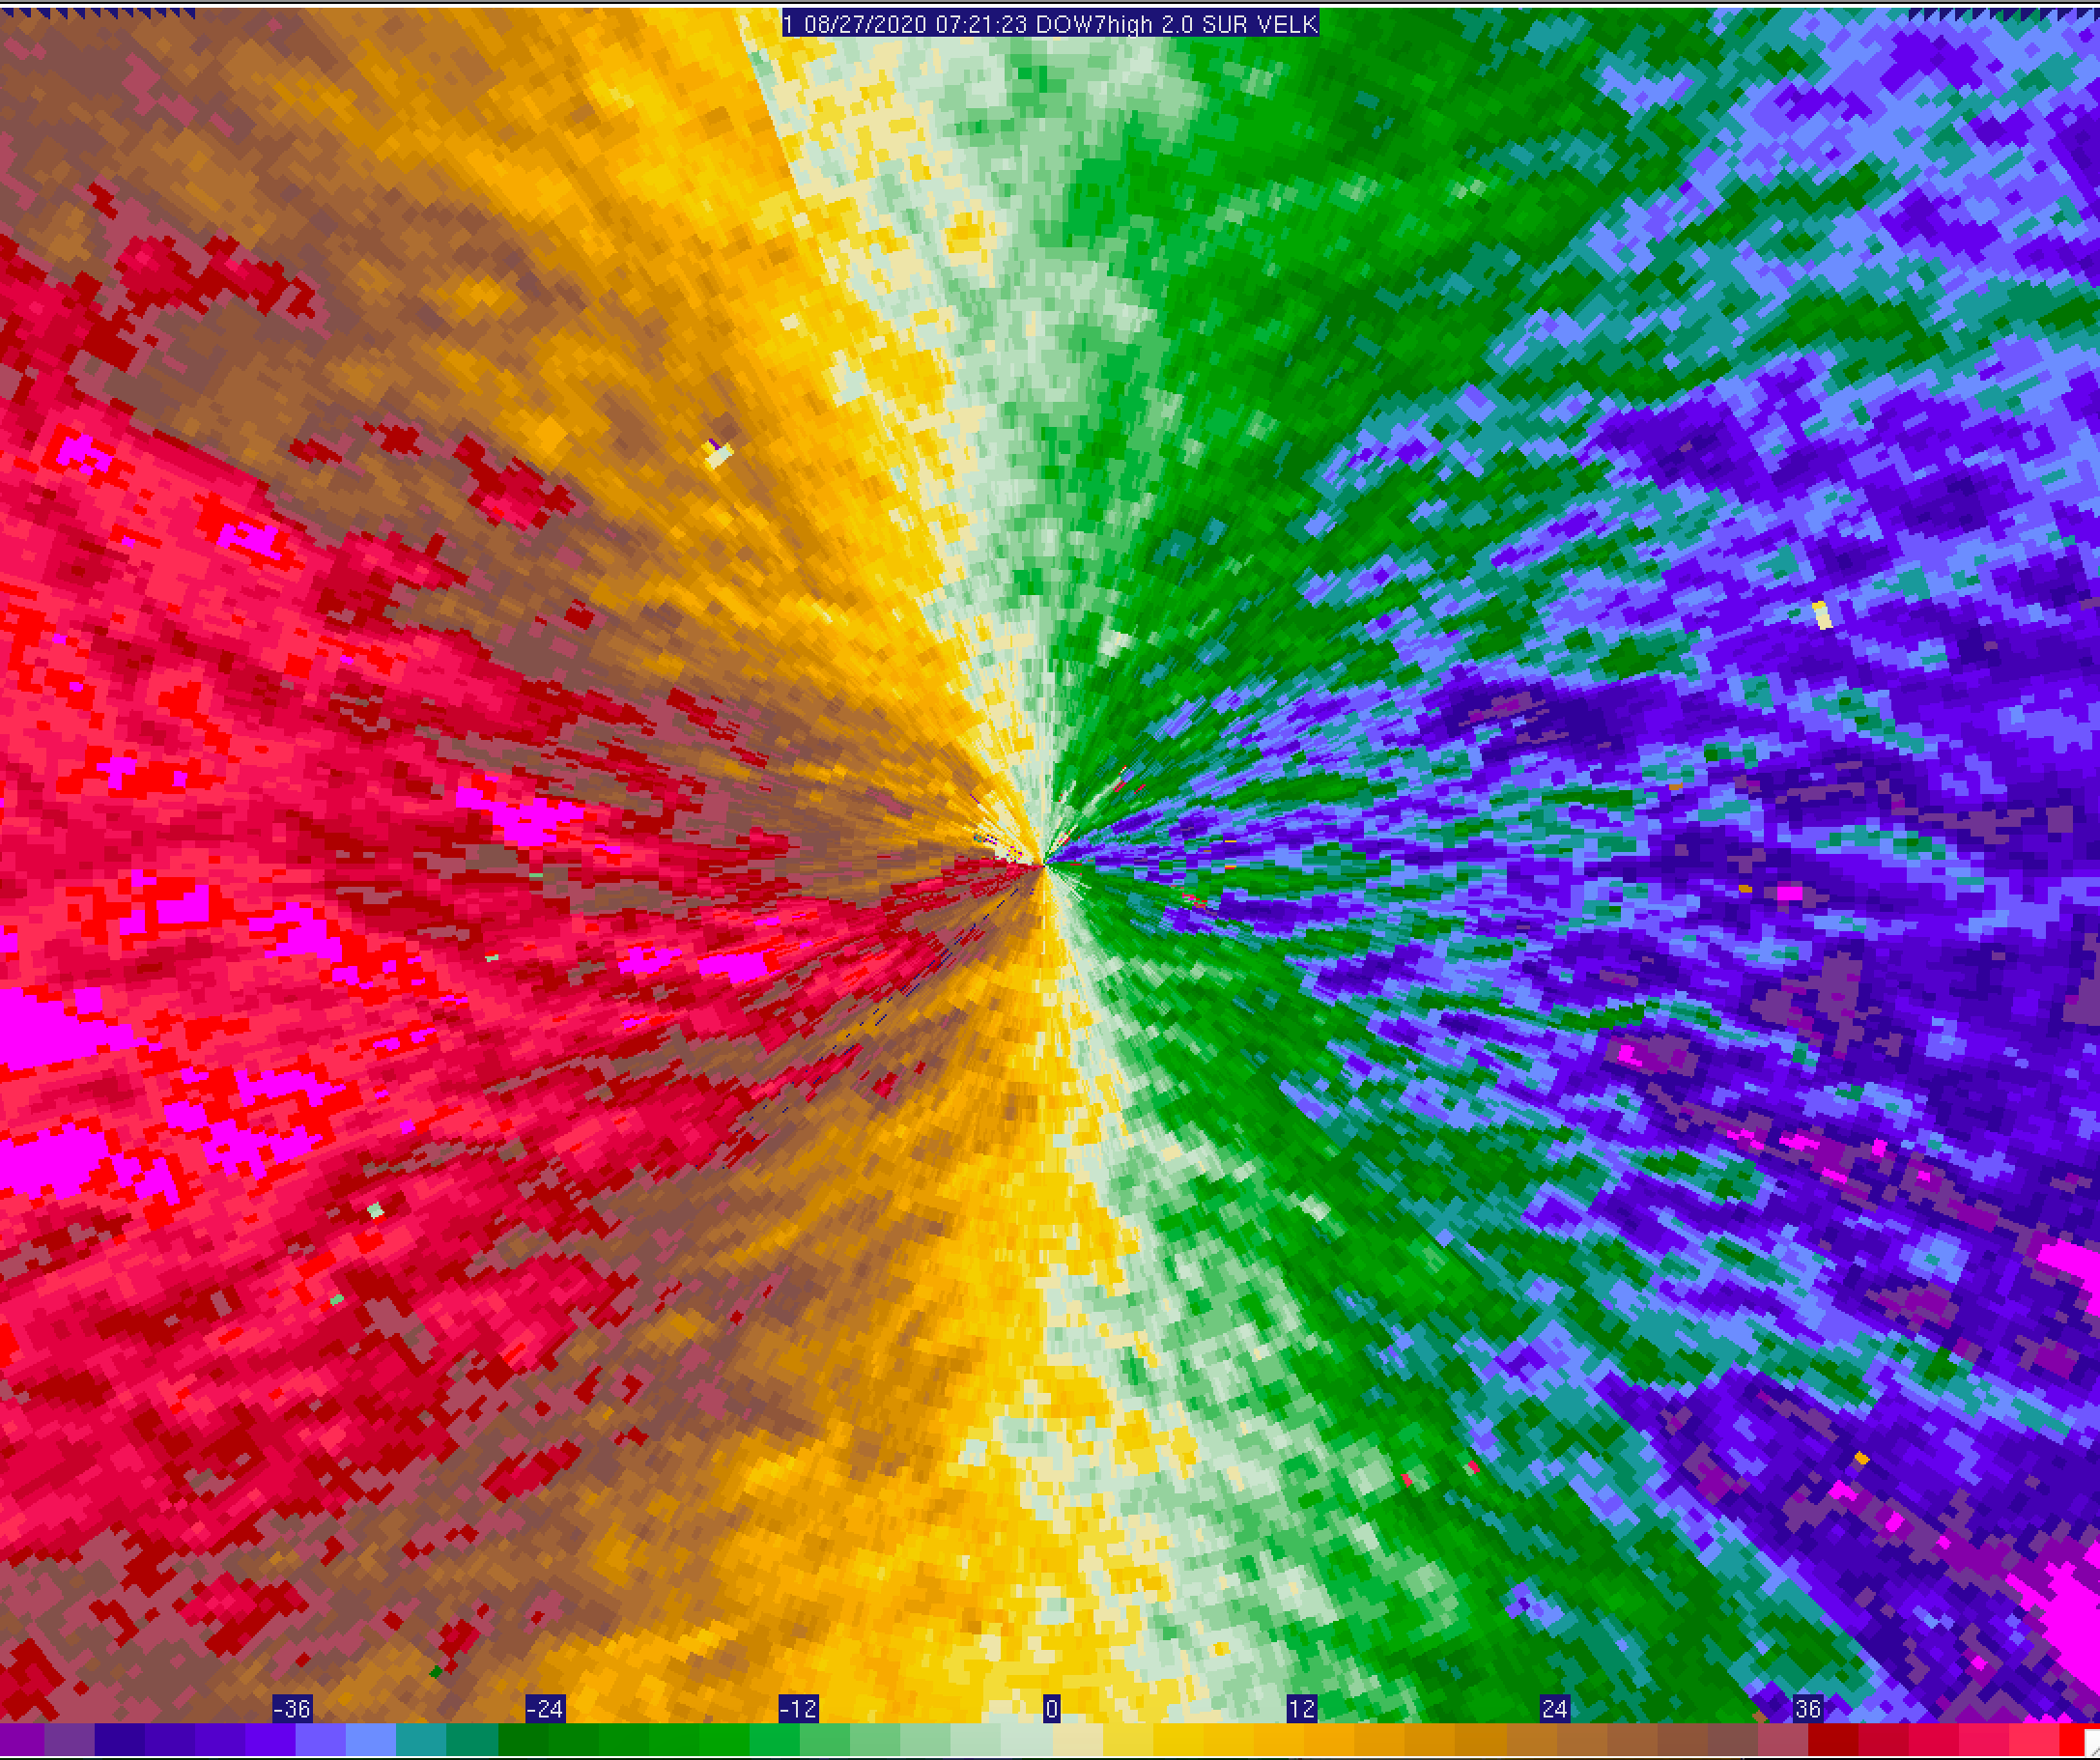
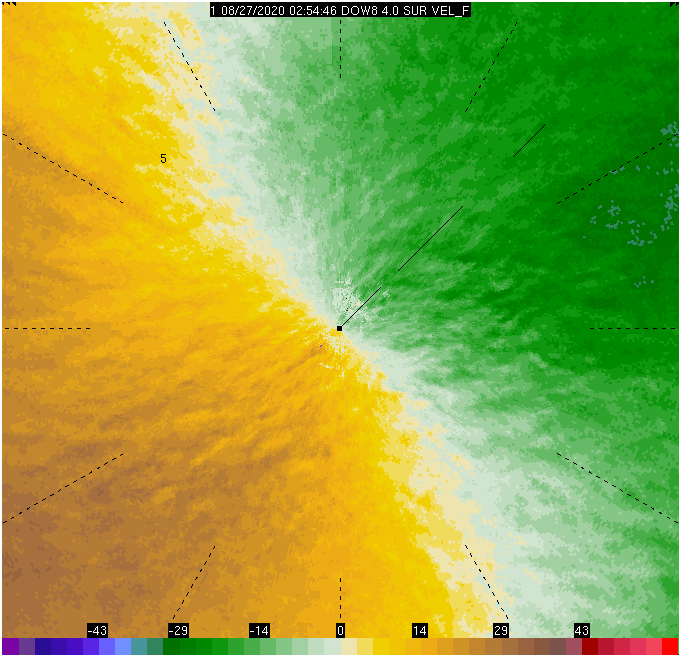
Eye moving away from Lake Charles. Note the various spatial scales of flow in the DOW7 Doppler velocity (m/s).
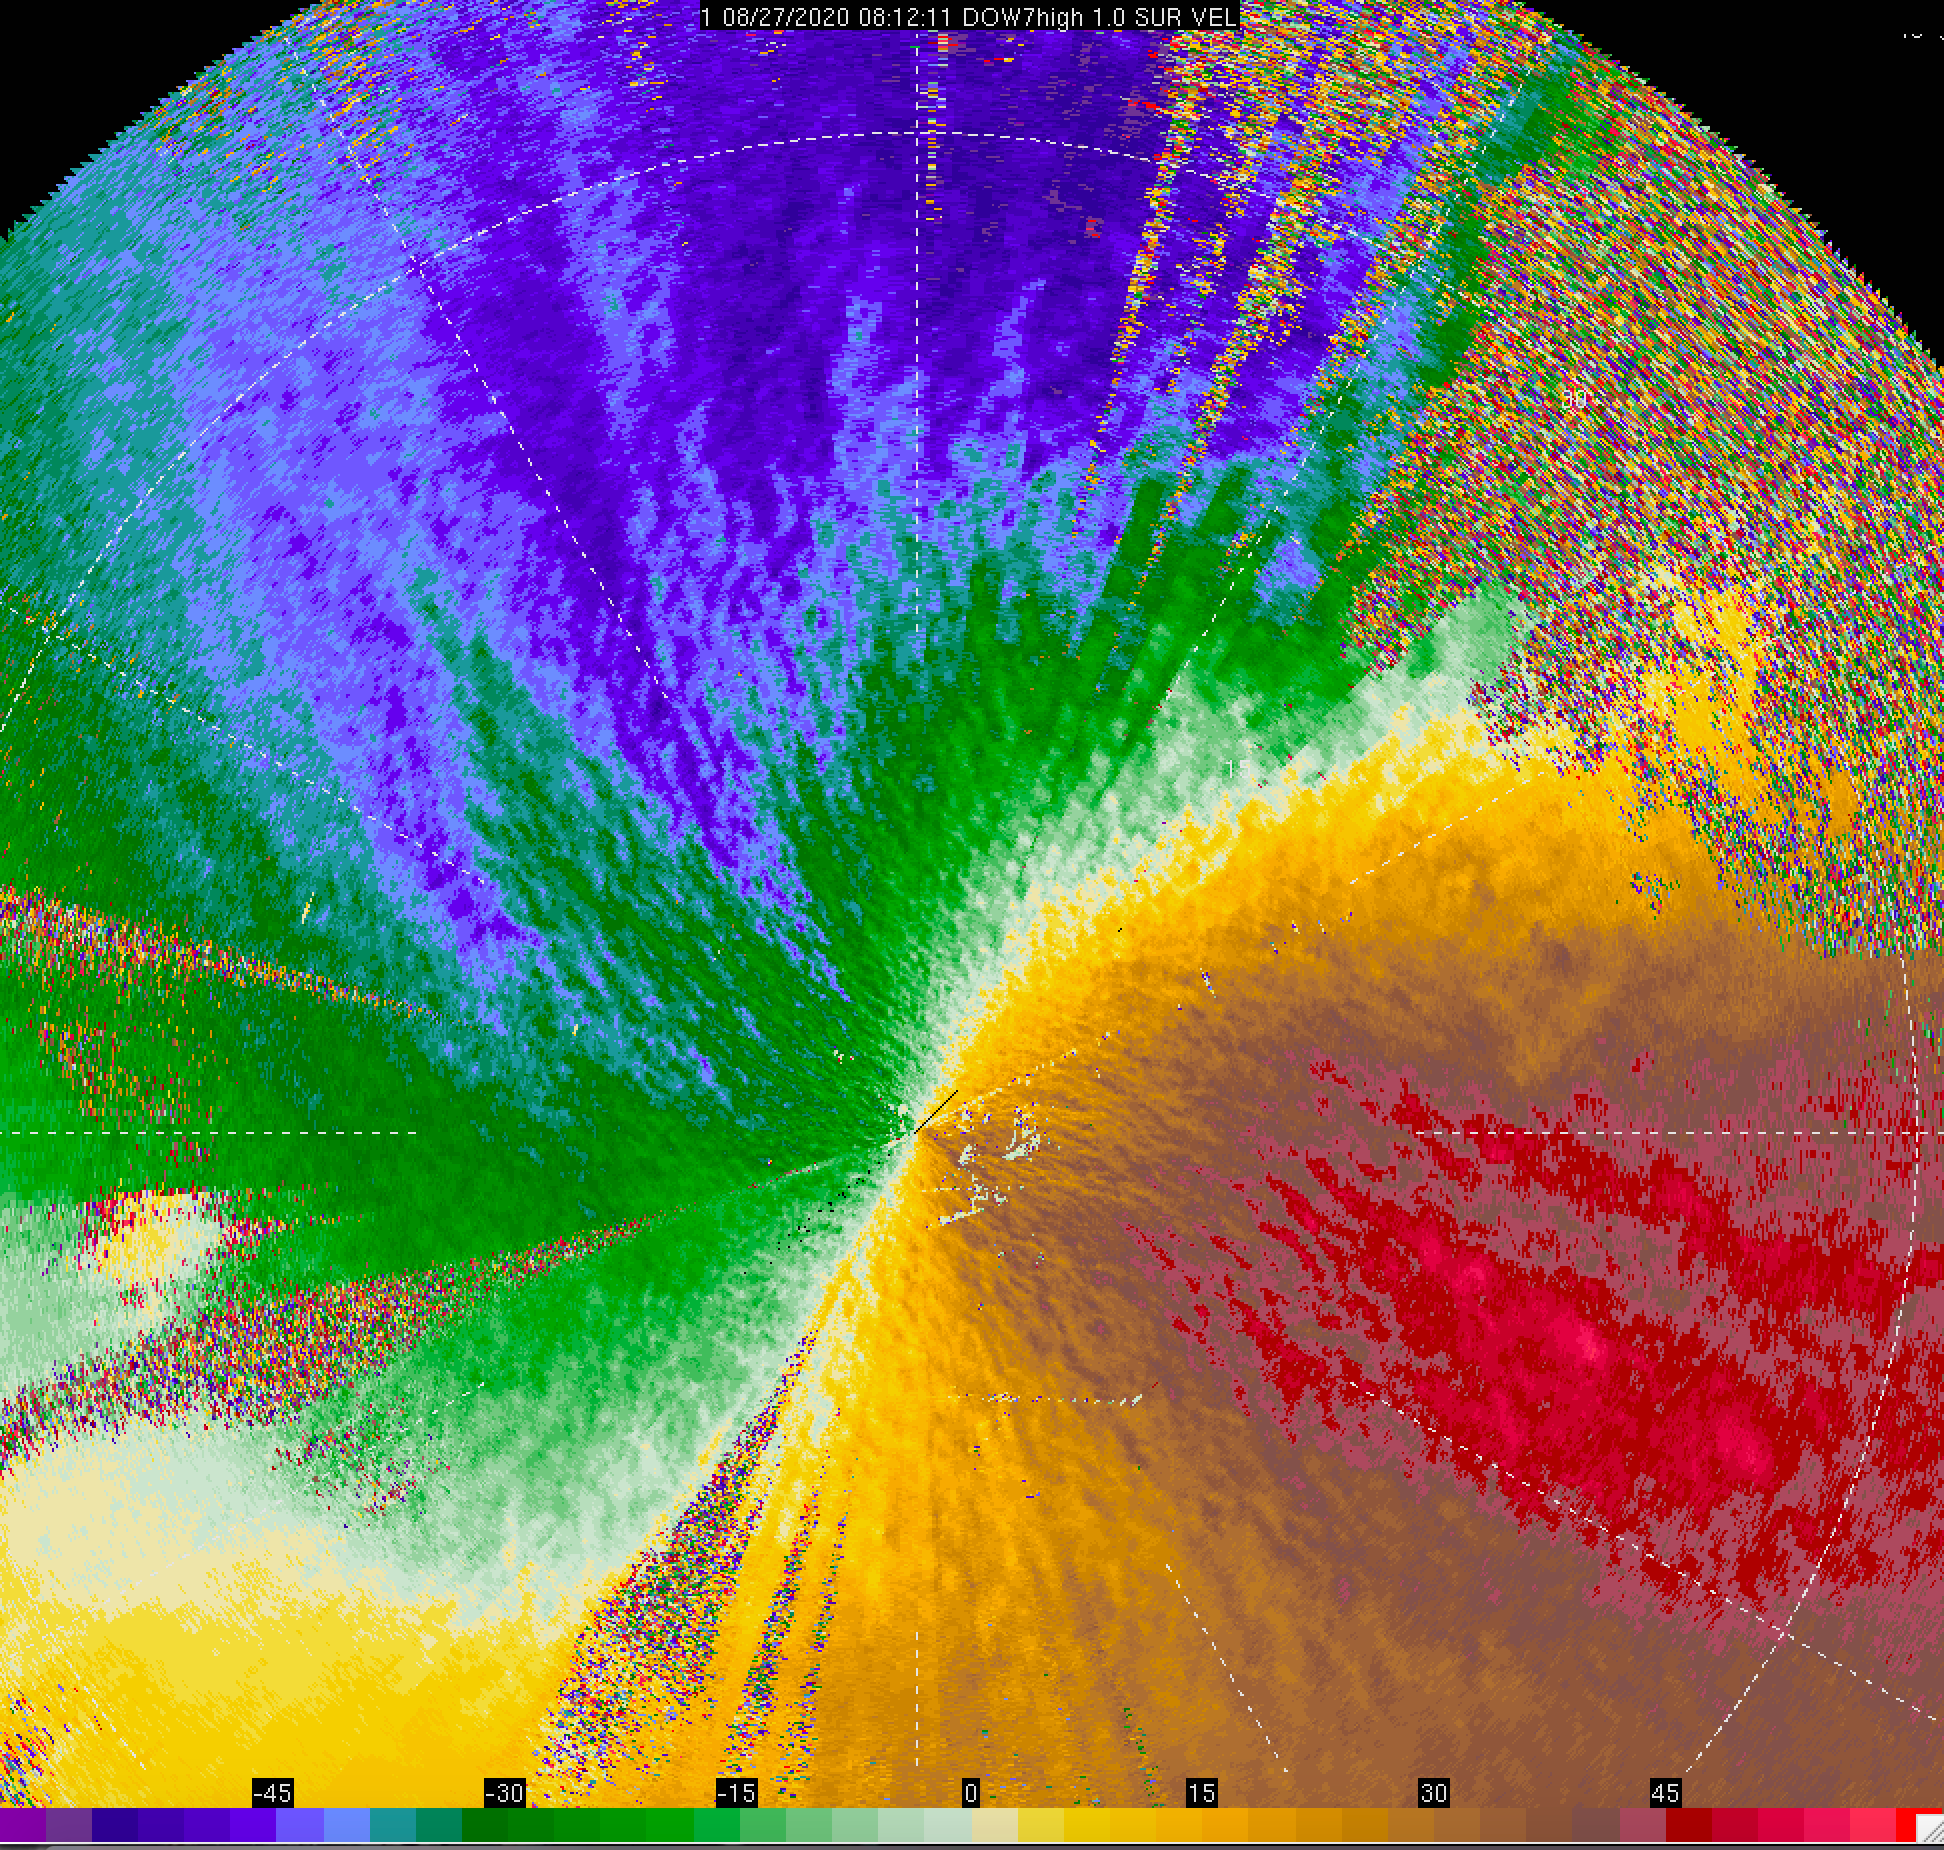
Wind streaks impacting the DOW7 radar location. The peak 1-second wind gust was 49.6 m/s at ~8 m above DOW level (ADL). Doppler velocity in m/s is shown.
Animated radar loop from DOW7 showing the full evolution of Hurricane Laura as it made landfall. Left panel is reflectivity; Right panel is Doppler velocity in m/s.
Animated radar loop from DOW7 zoomed in on the wind streaks impacting the DOW7 radar location. Doppler velocity in m/s is shown.
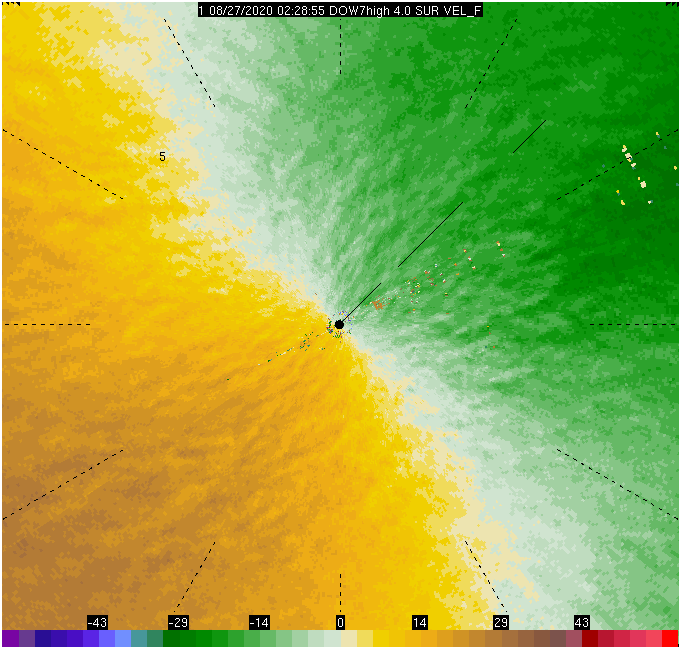
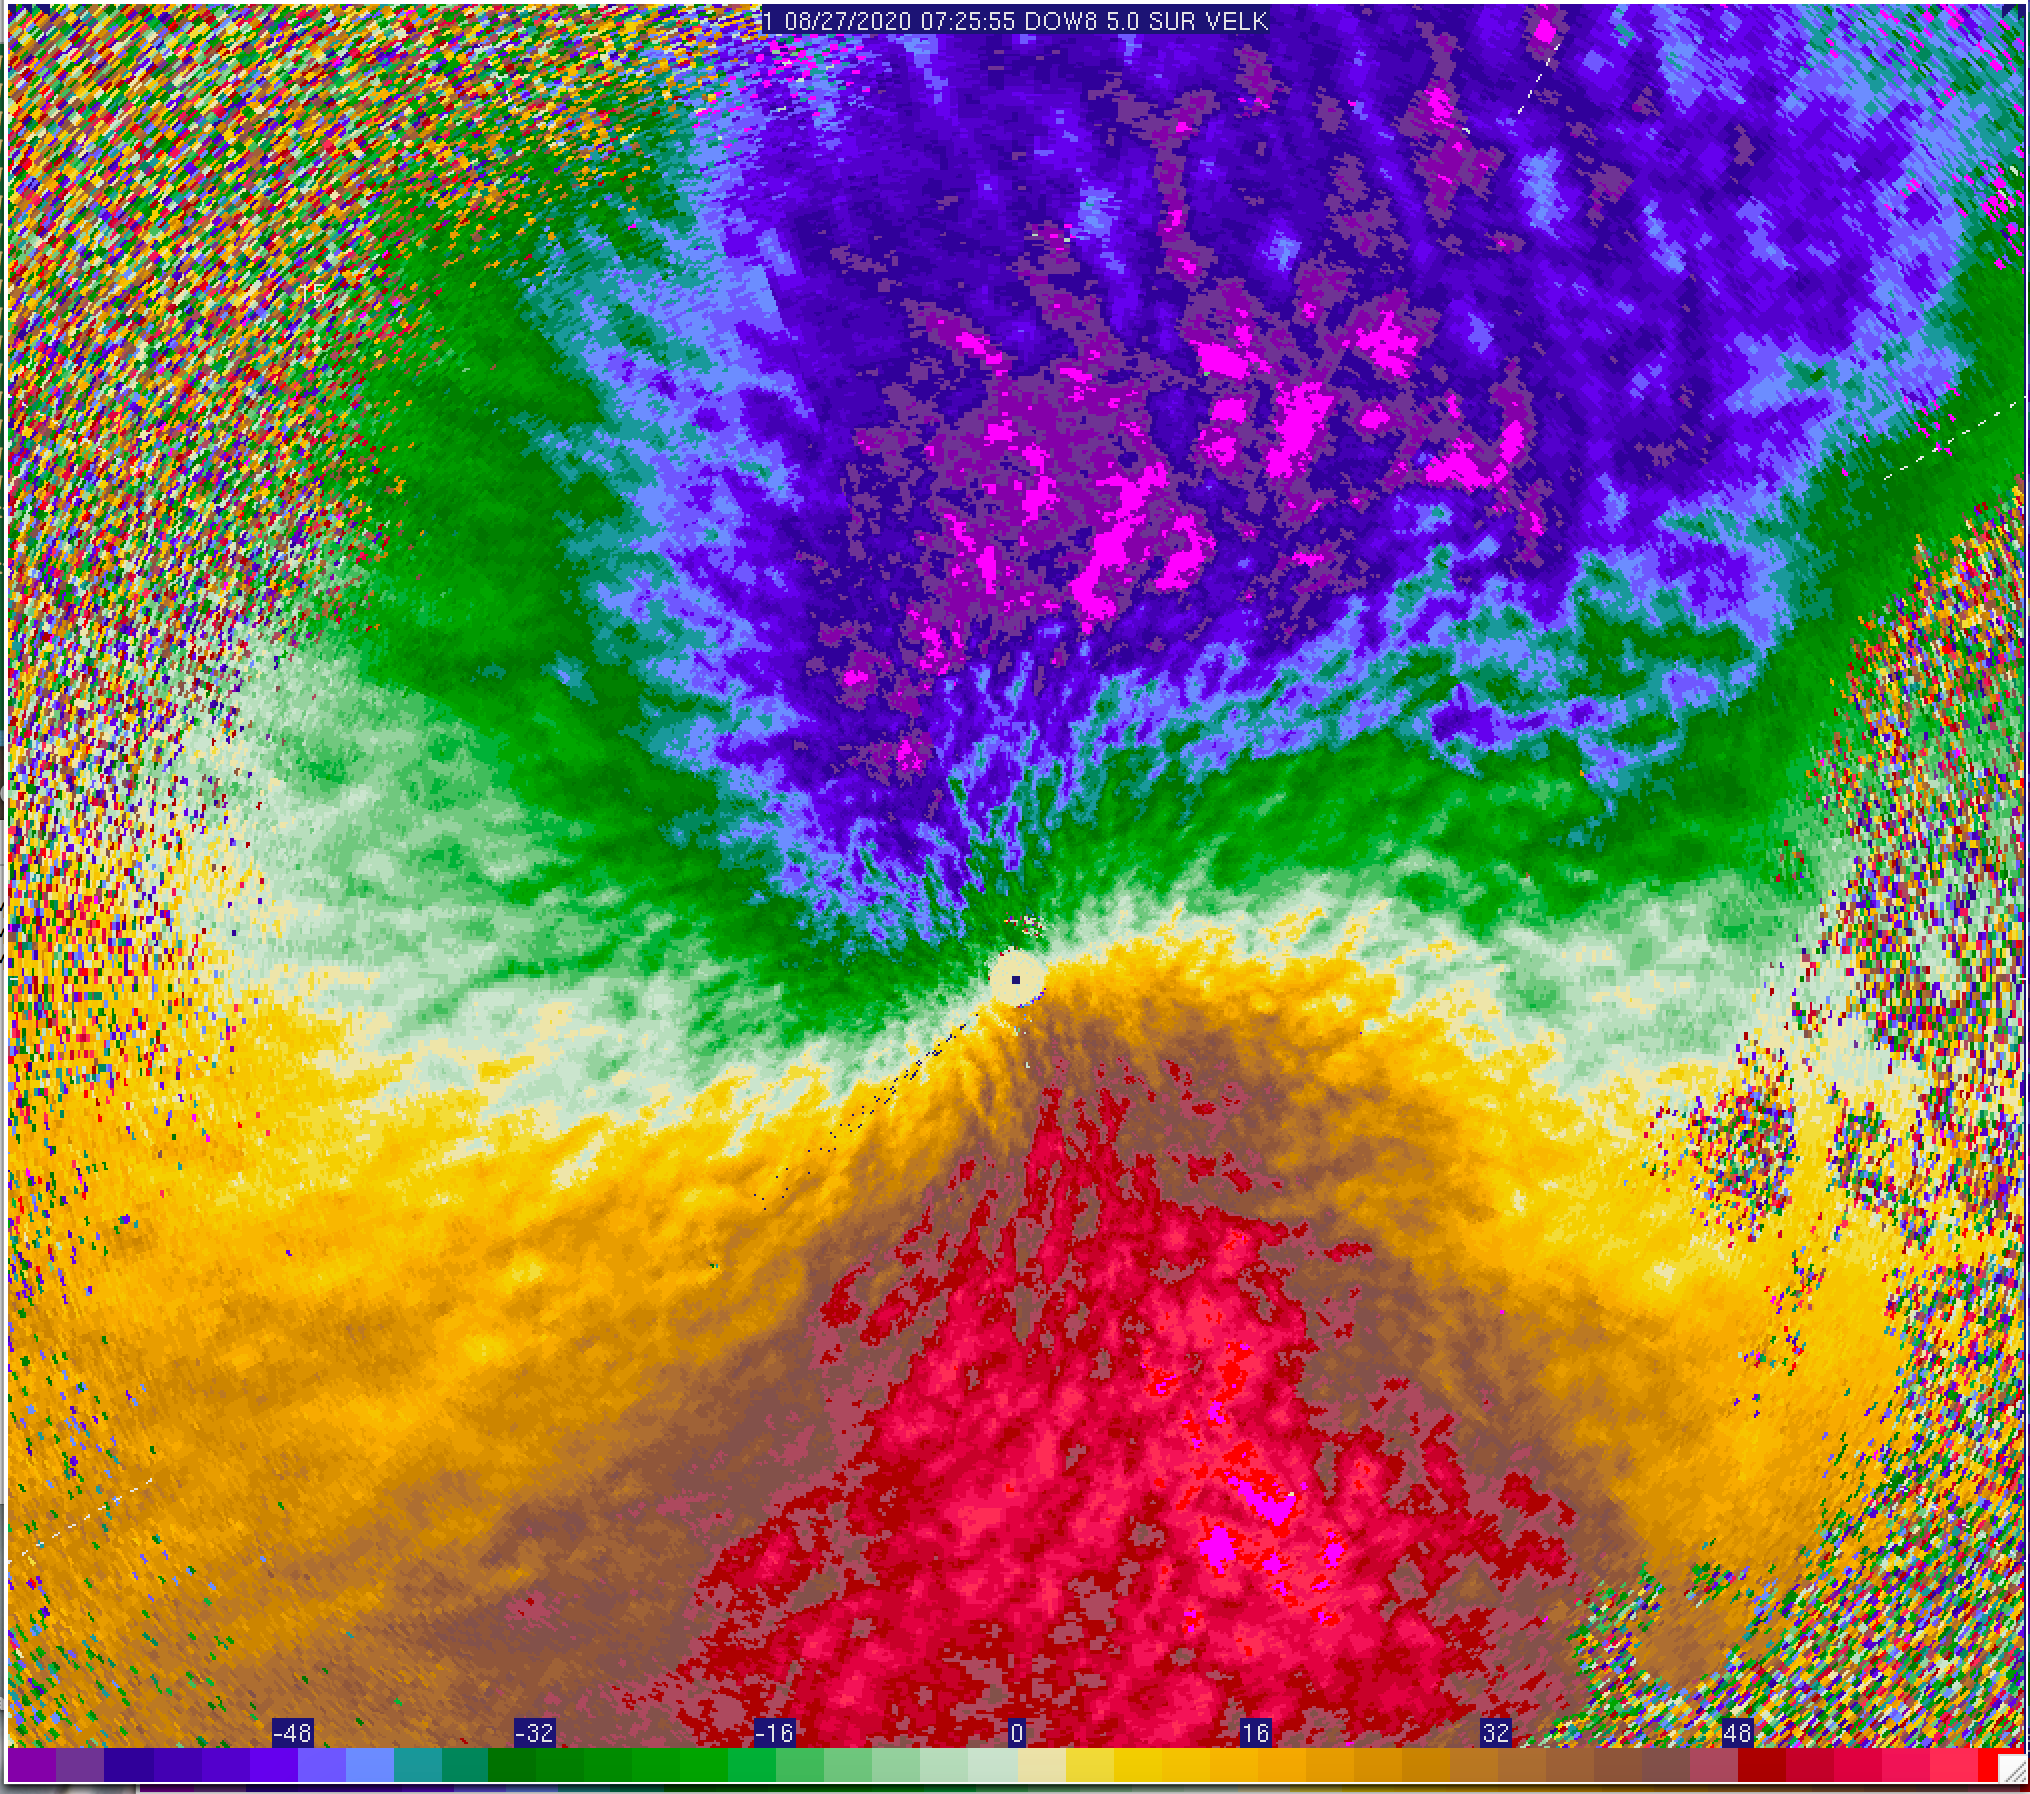
Wind streaks impacting the DOW8 radar location, deployed near the radius of maximum winds (RMW). The edge of the eyewall precipitation was ~10 km east of their location. Doppler velocity in m/s is shown.
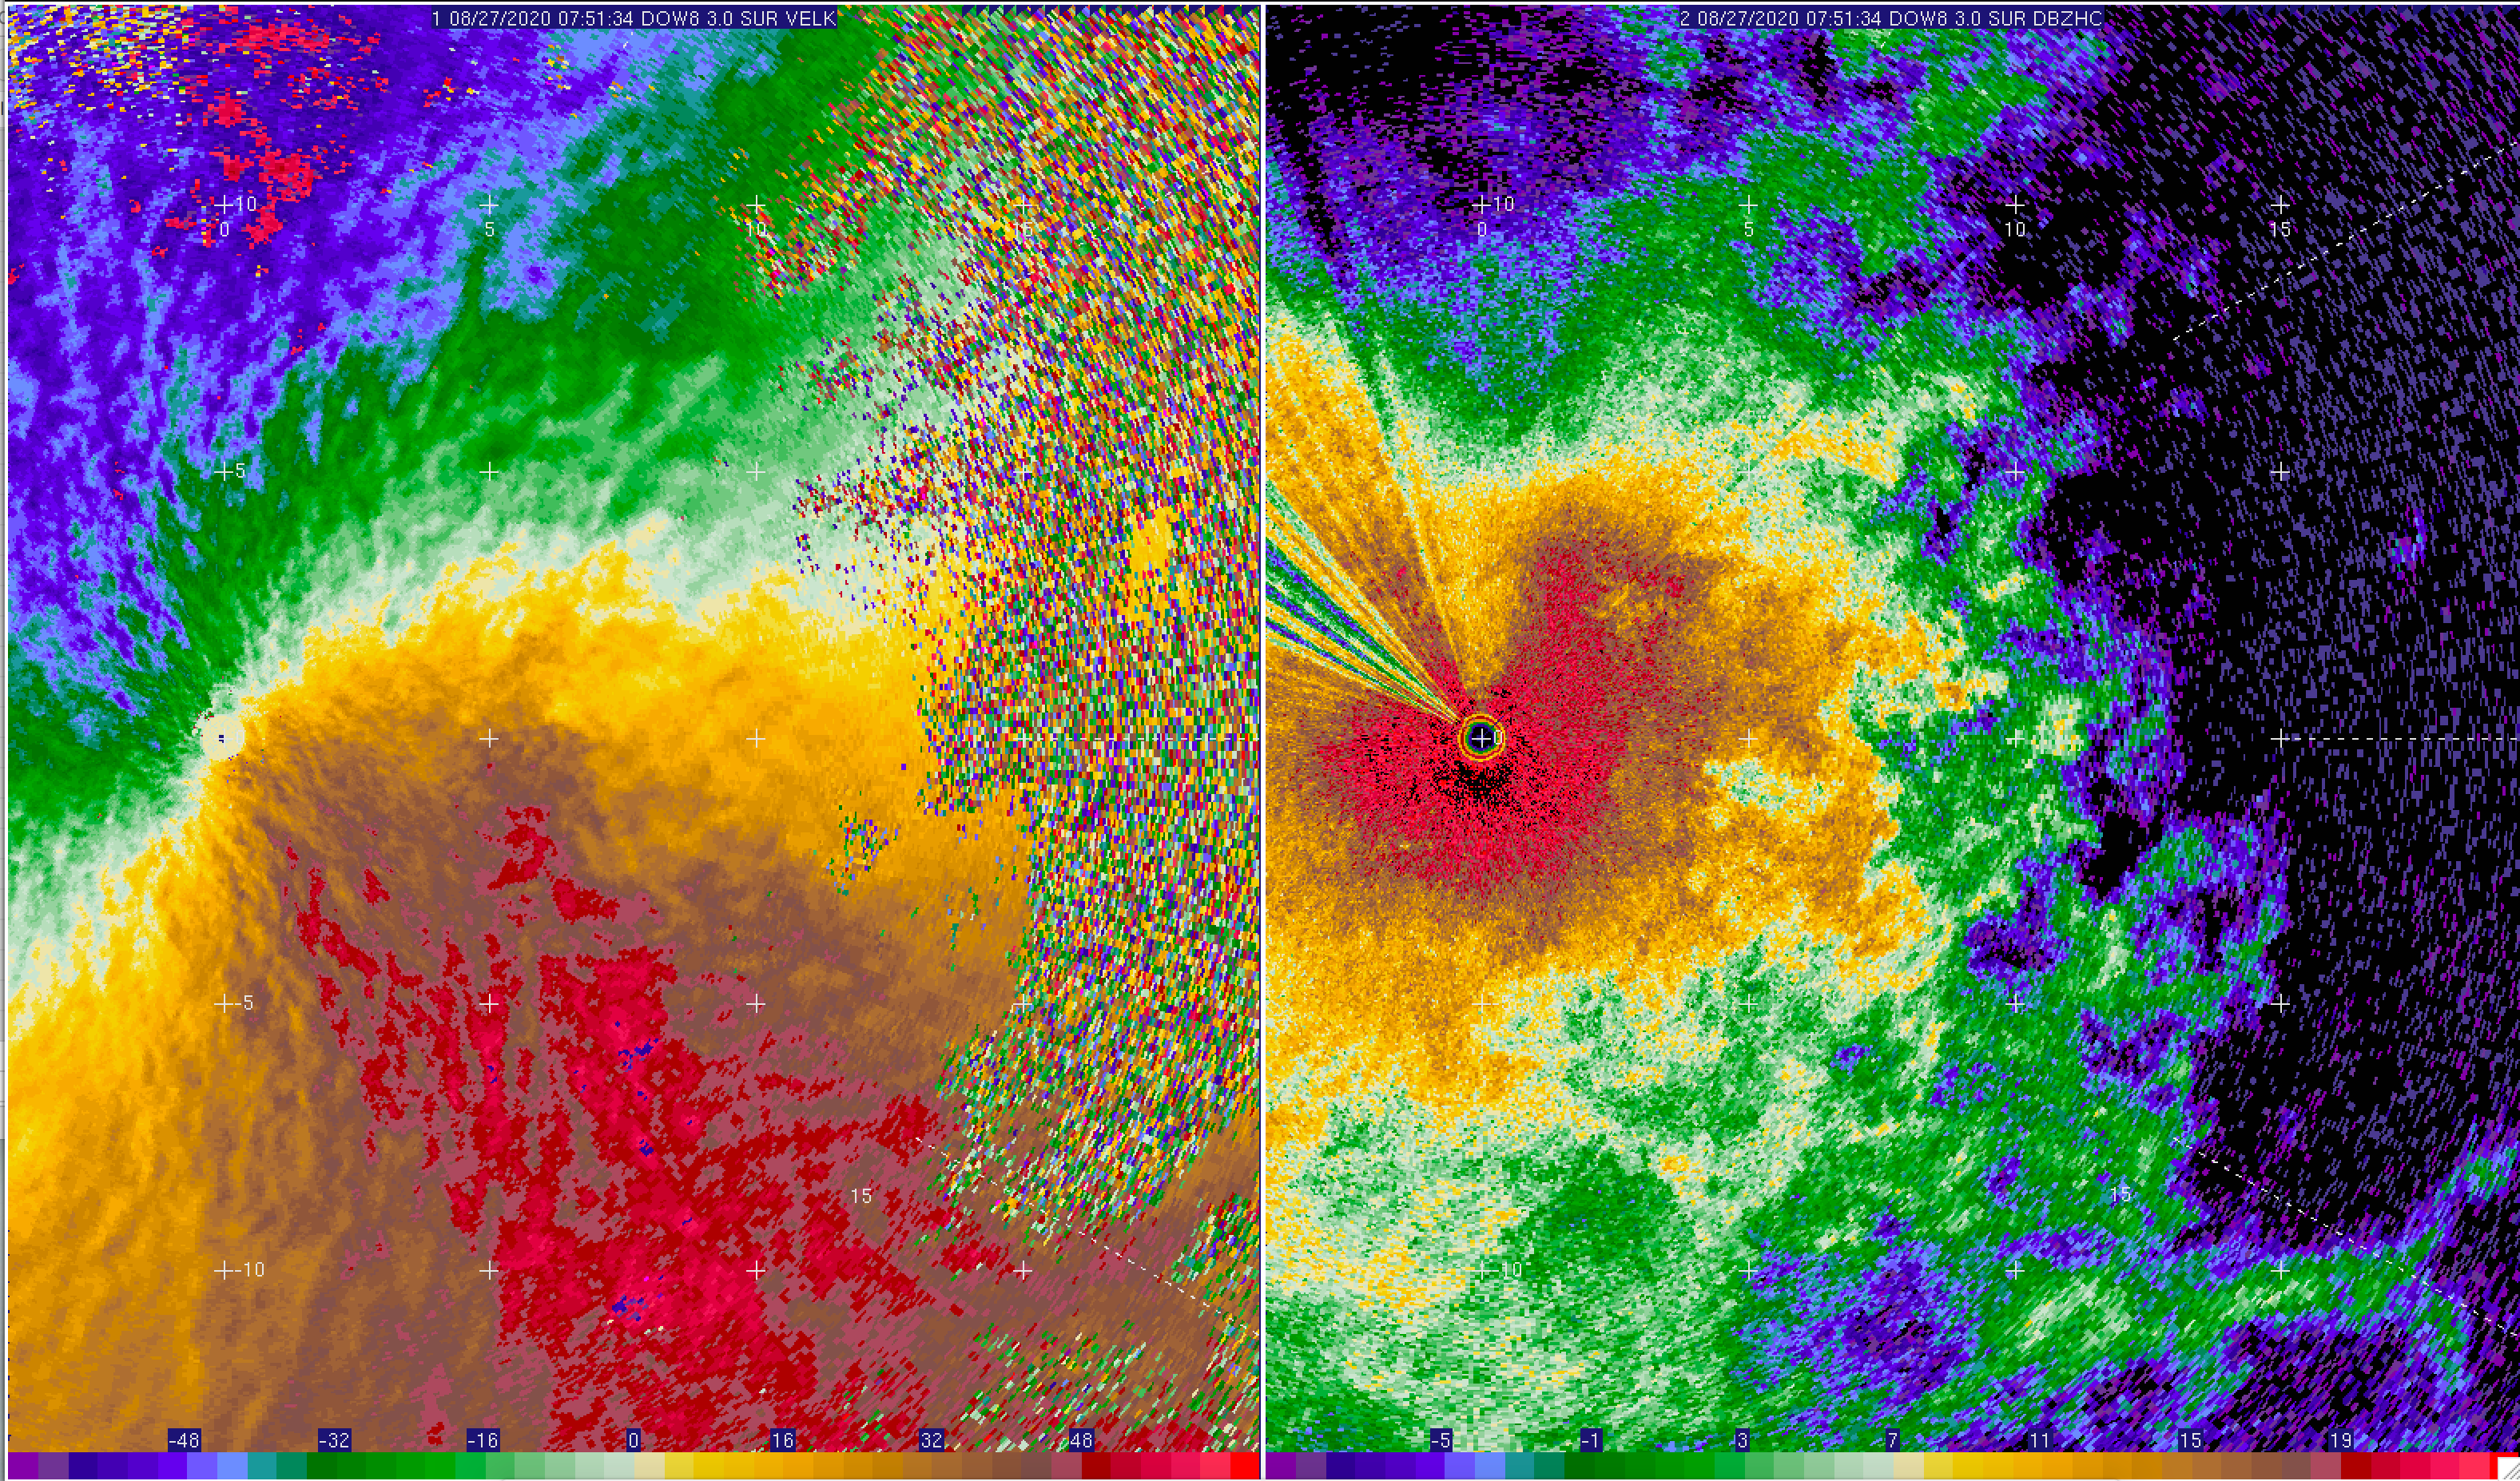
Inner edge of eyewall at DOW8 showing the small-scale detail inside RMW crenelations visible in pre-failure KLCH imagery. Left panel is reflectivity; Right panel is Doppler velocity in m/s.
Animated radar loop from DOW8 showing the full evolution of Hurricane Laura as it made landfall. Left panel is reflectivity; Right panel is Doppler velocity in m/s.
Animated radar loop from DOW8 zoomed in on the wind streaks impacting the DOW8 radar location. Doppler velocity in m/s is shown.
DOW7 on site following the hurricane.
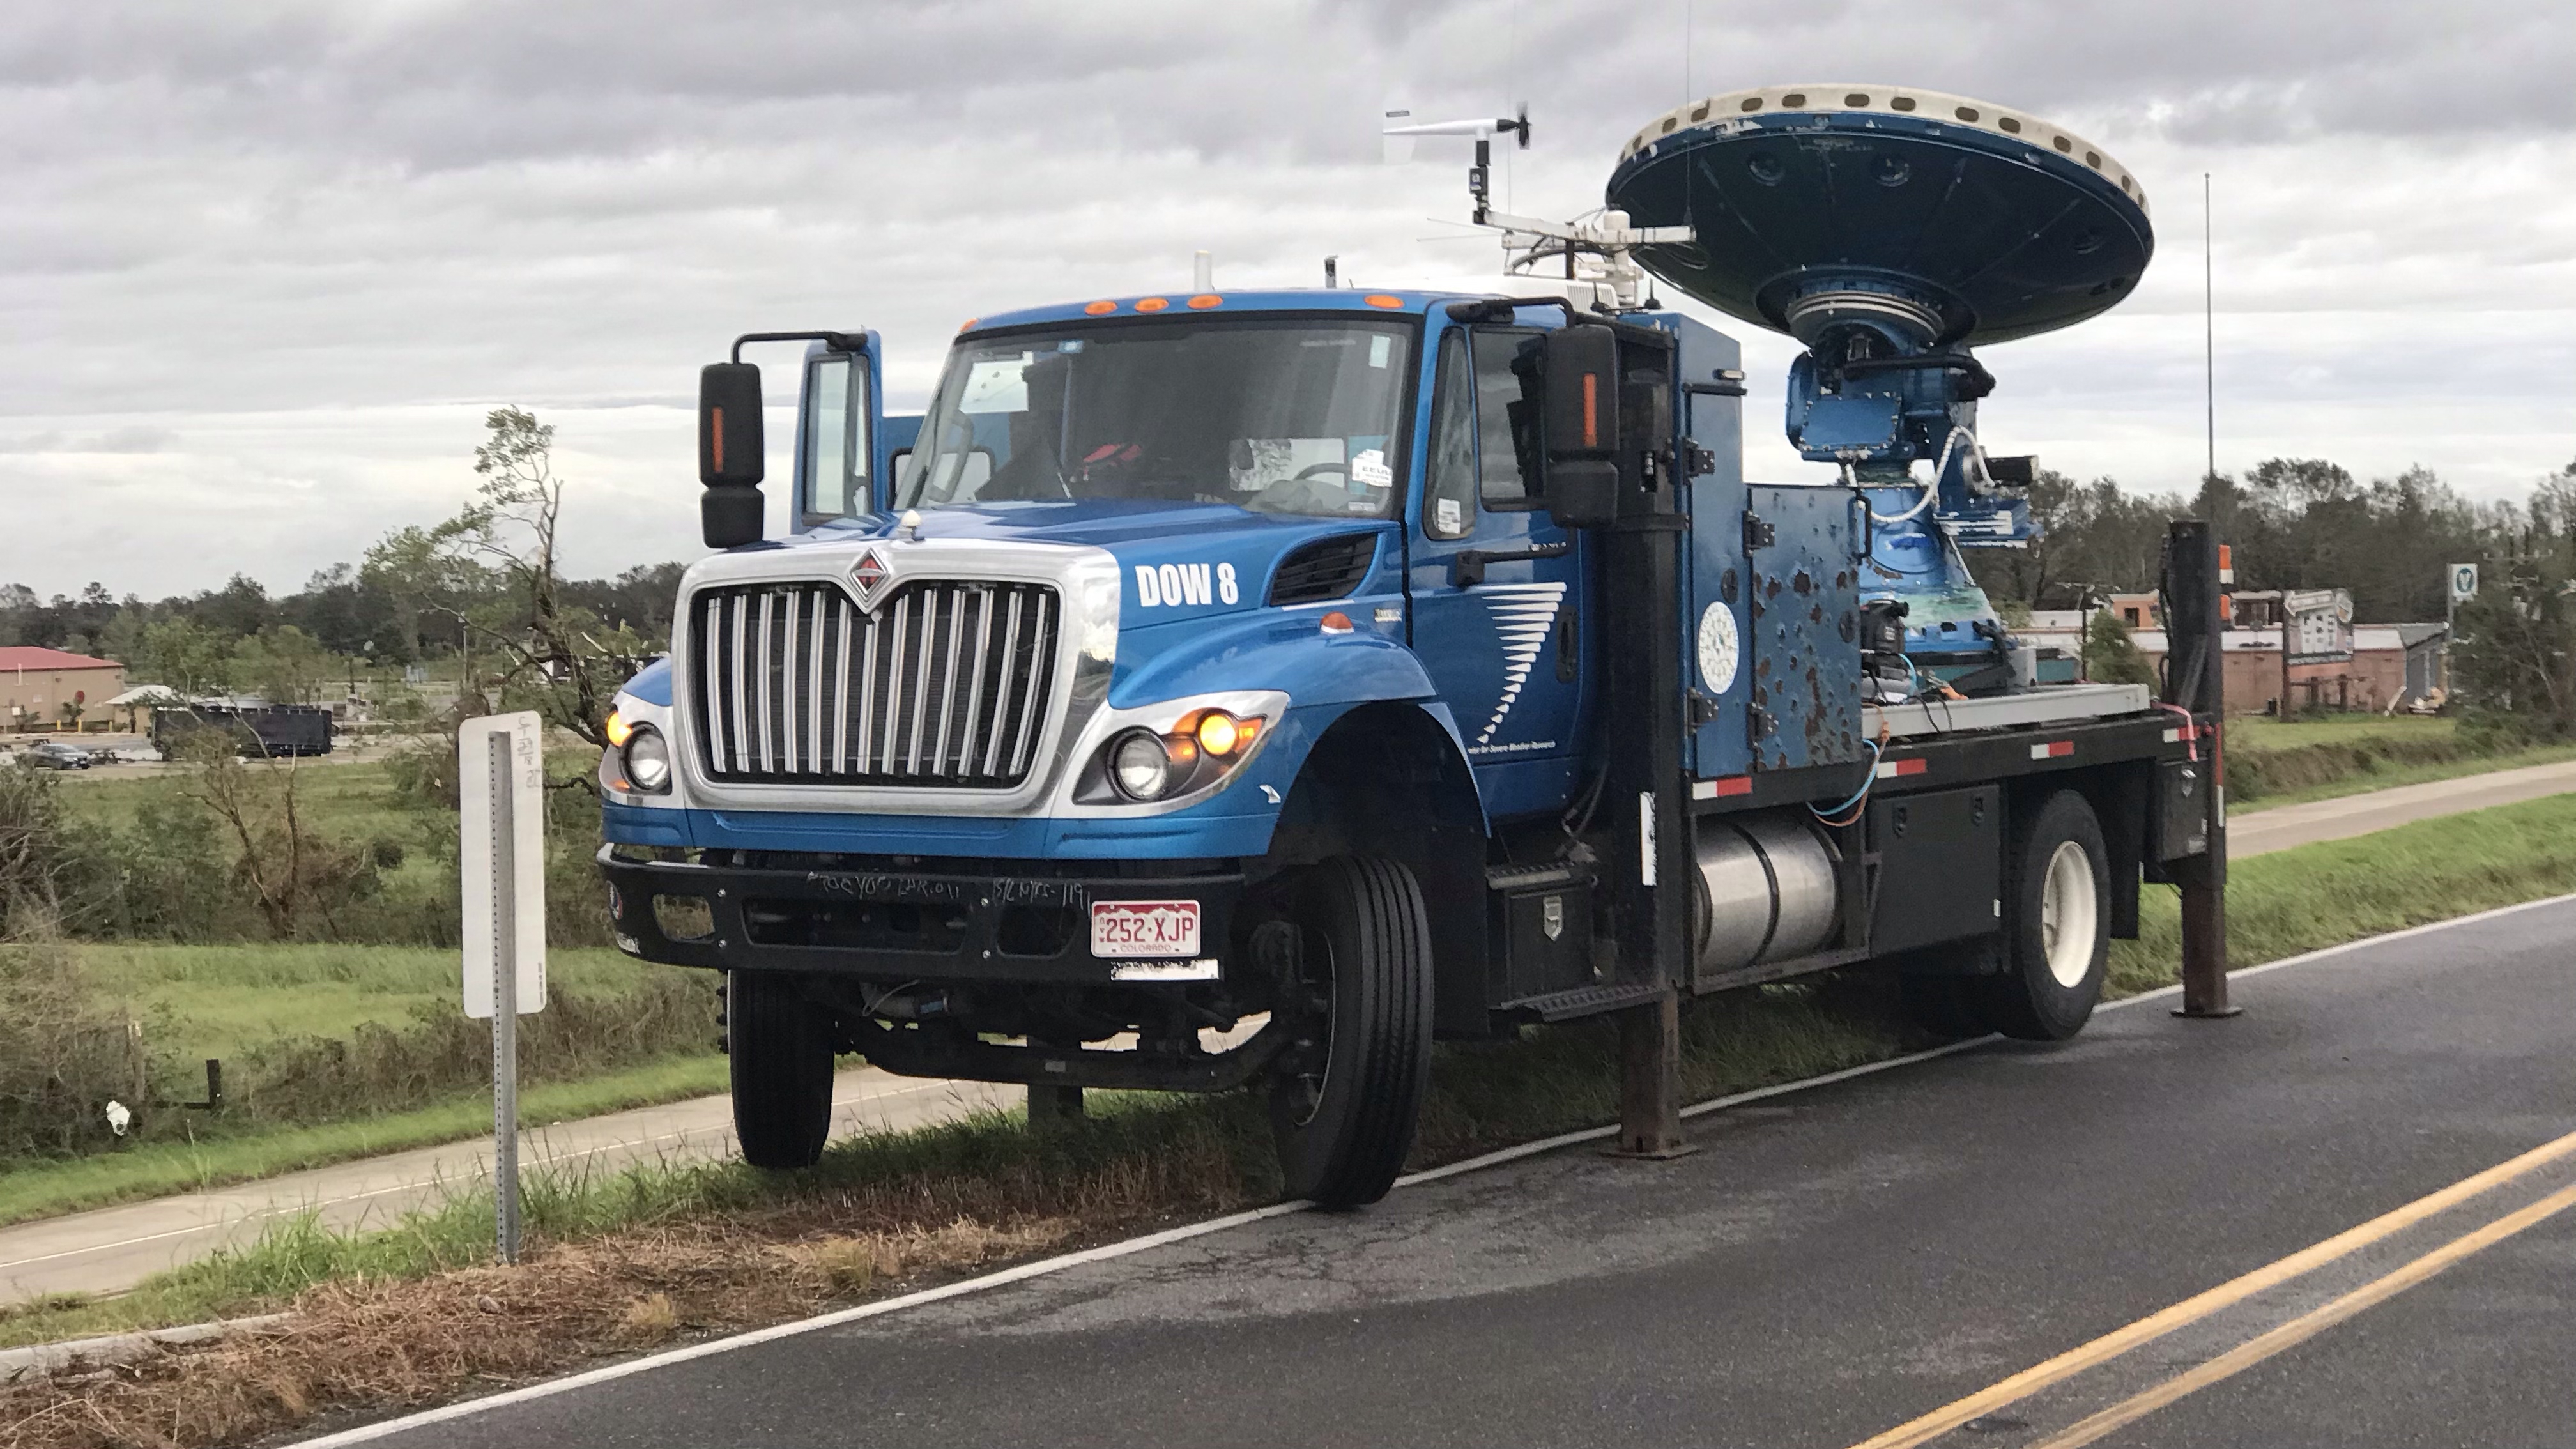
DOW8 on site following the hurricane.
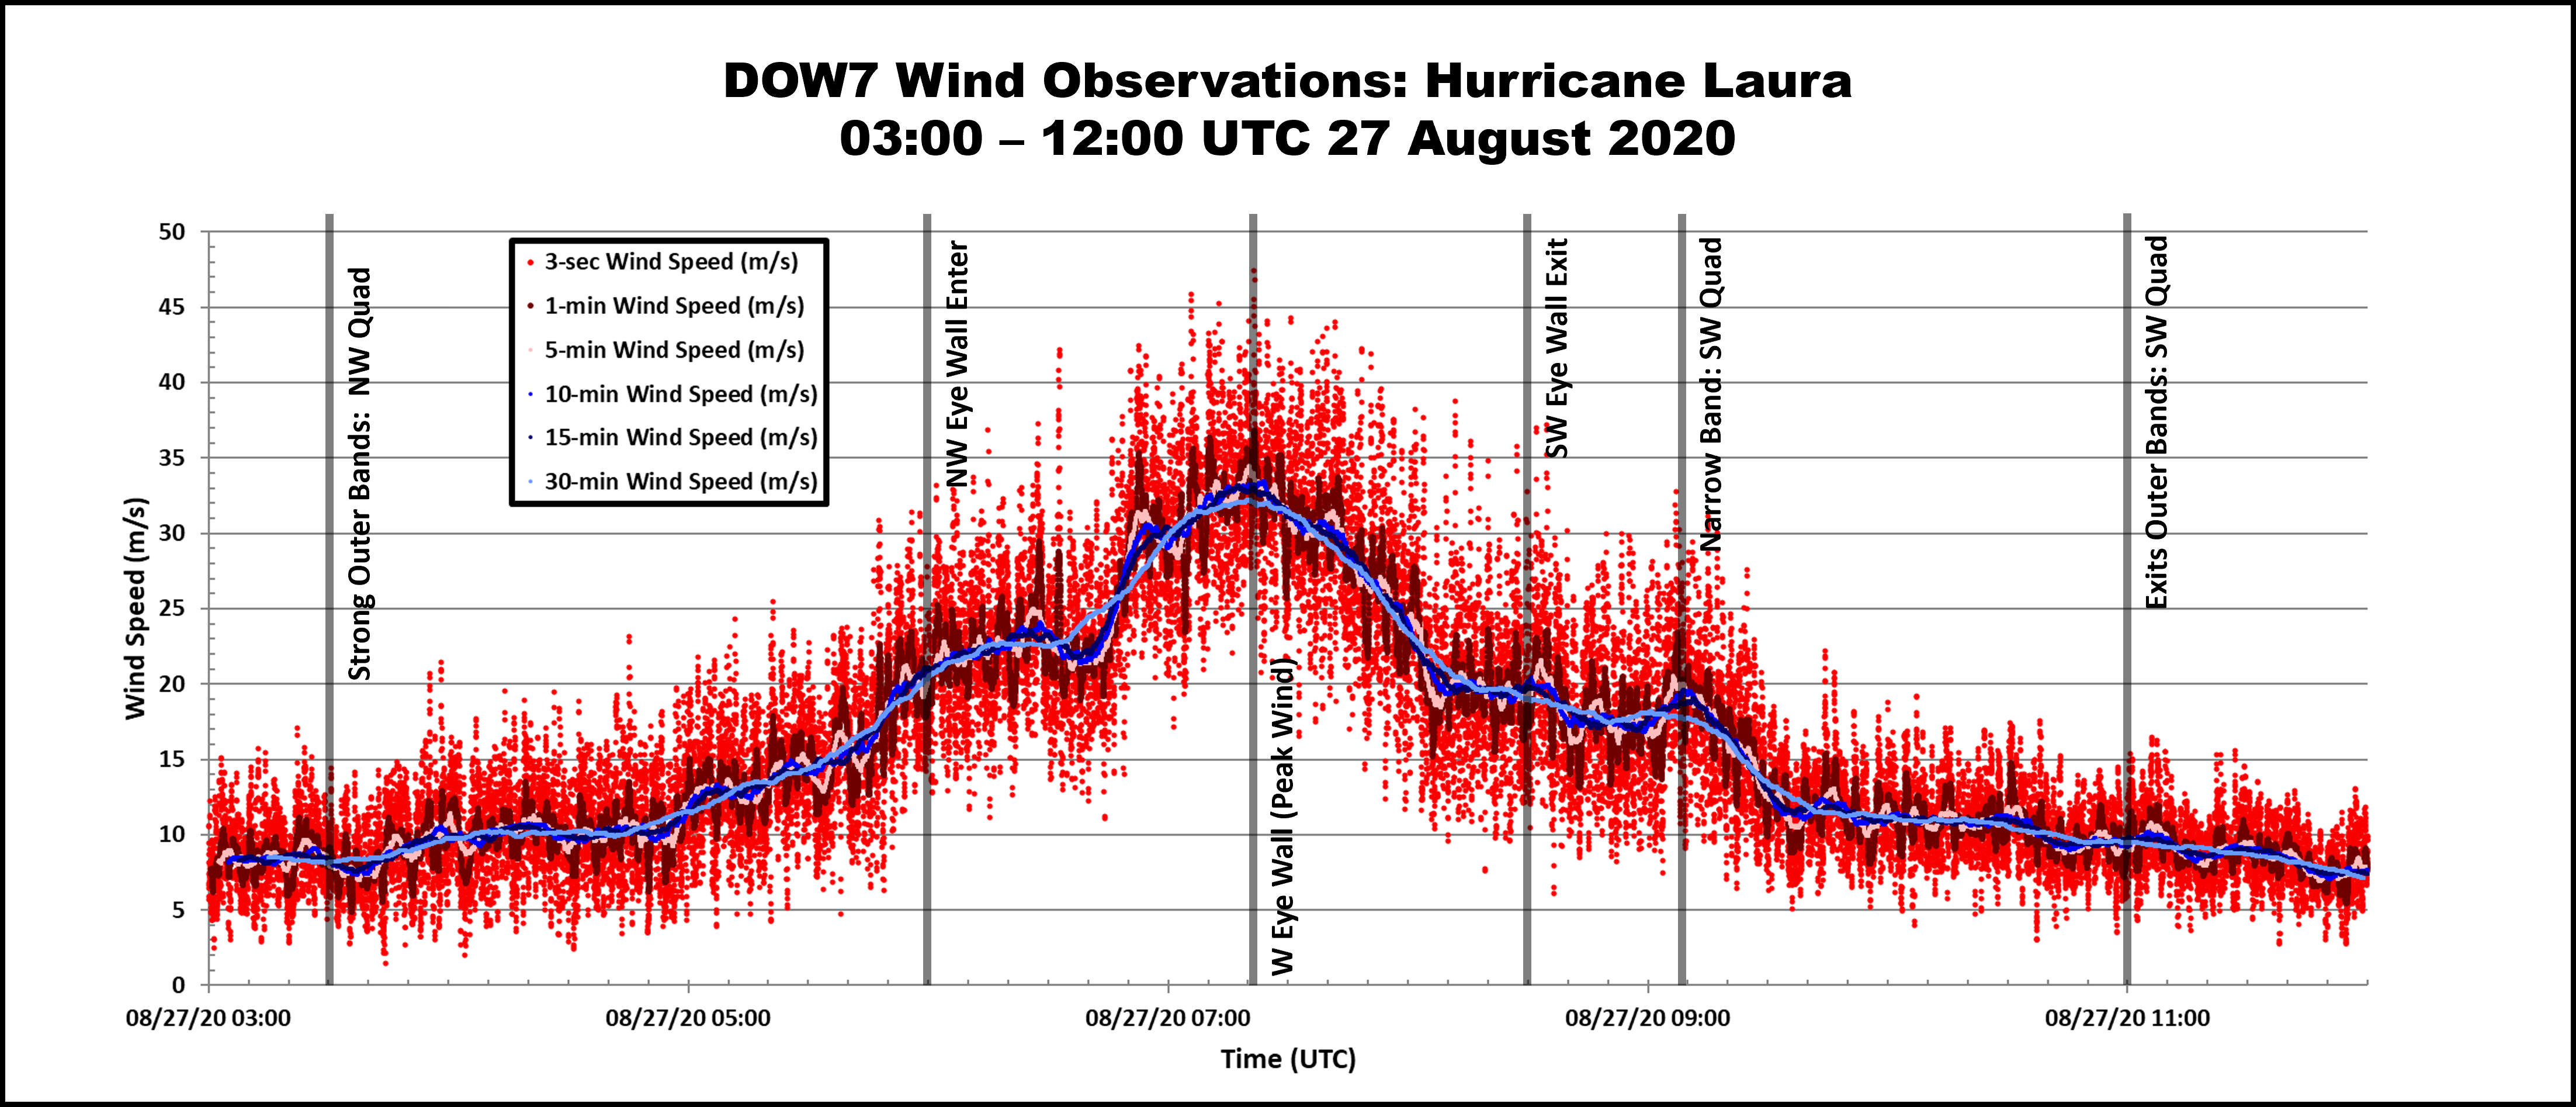
Observed wind speeds from the DOW7 mast ~10 m above the ground during the passage of Hurricane Laura. Some features of interest have been annotated. Wind averaging for the specified averaging intervals was done using a centered window.
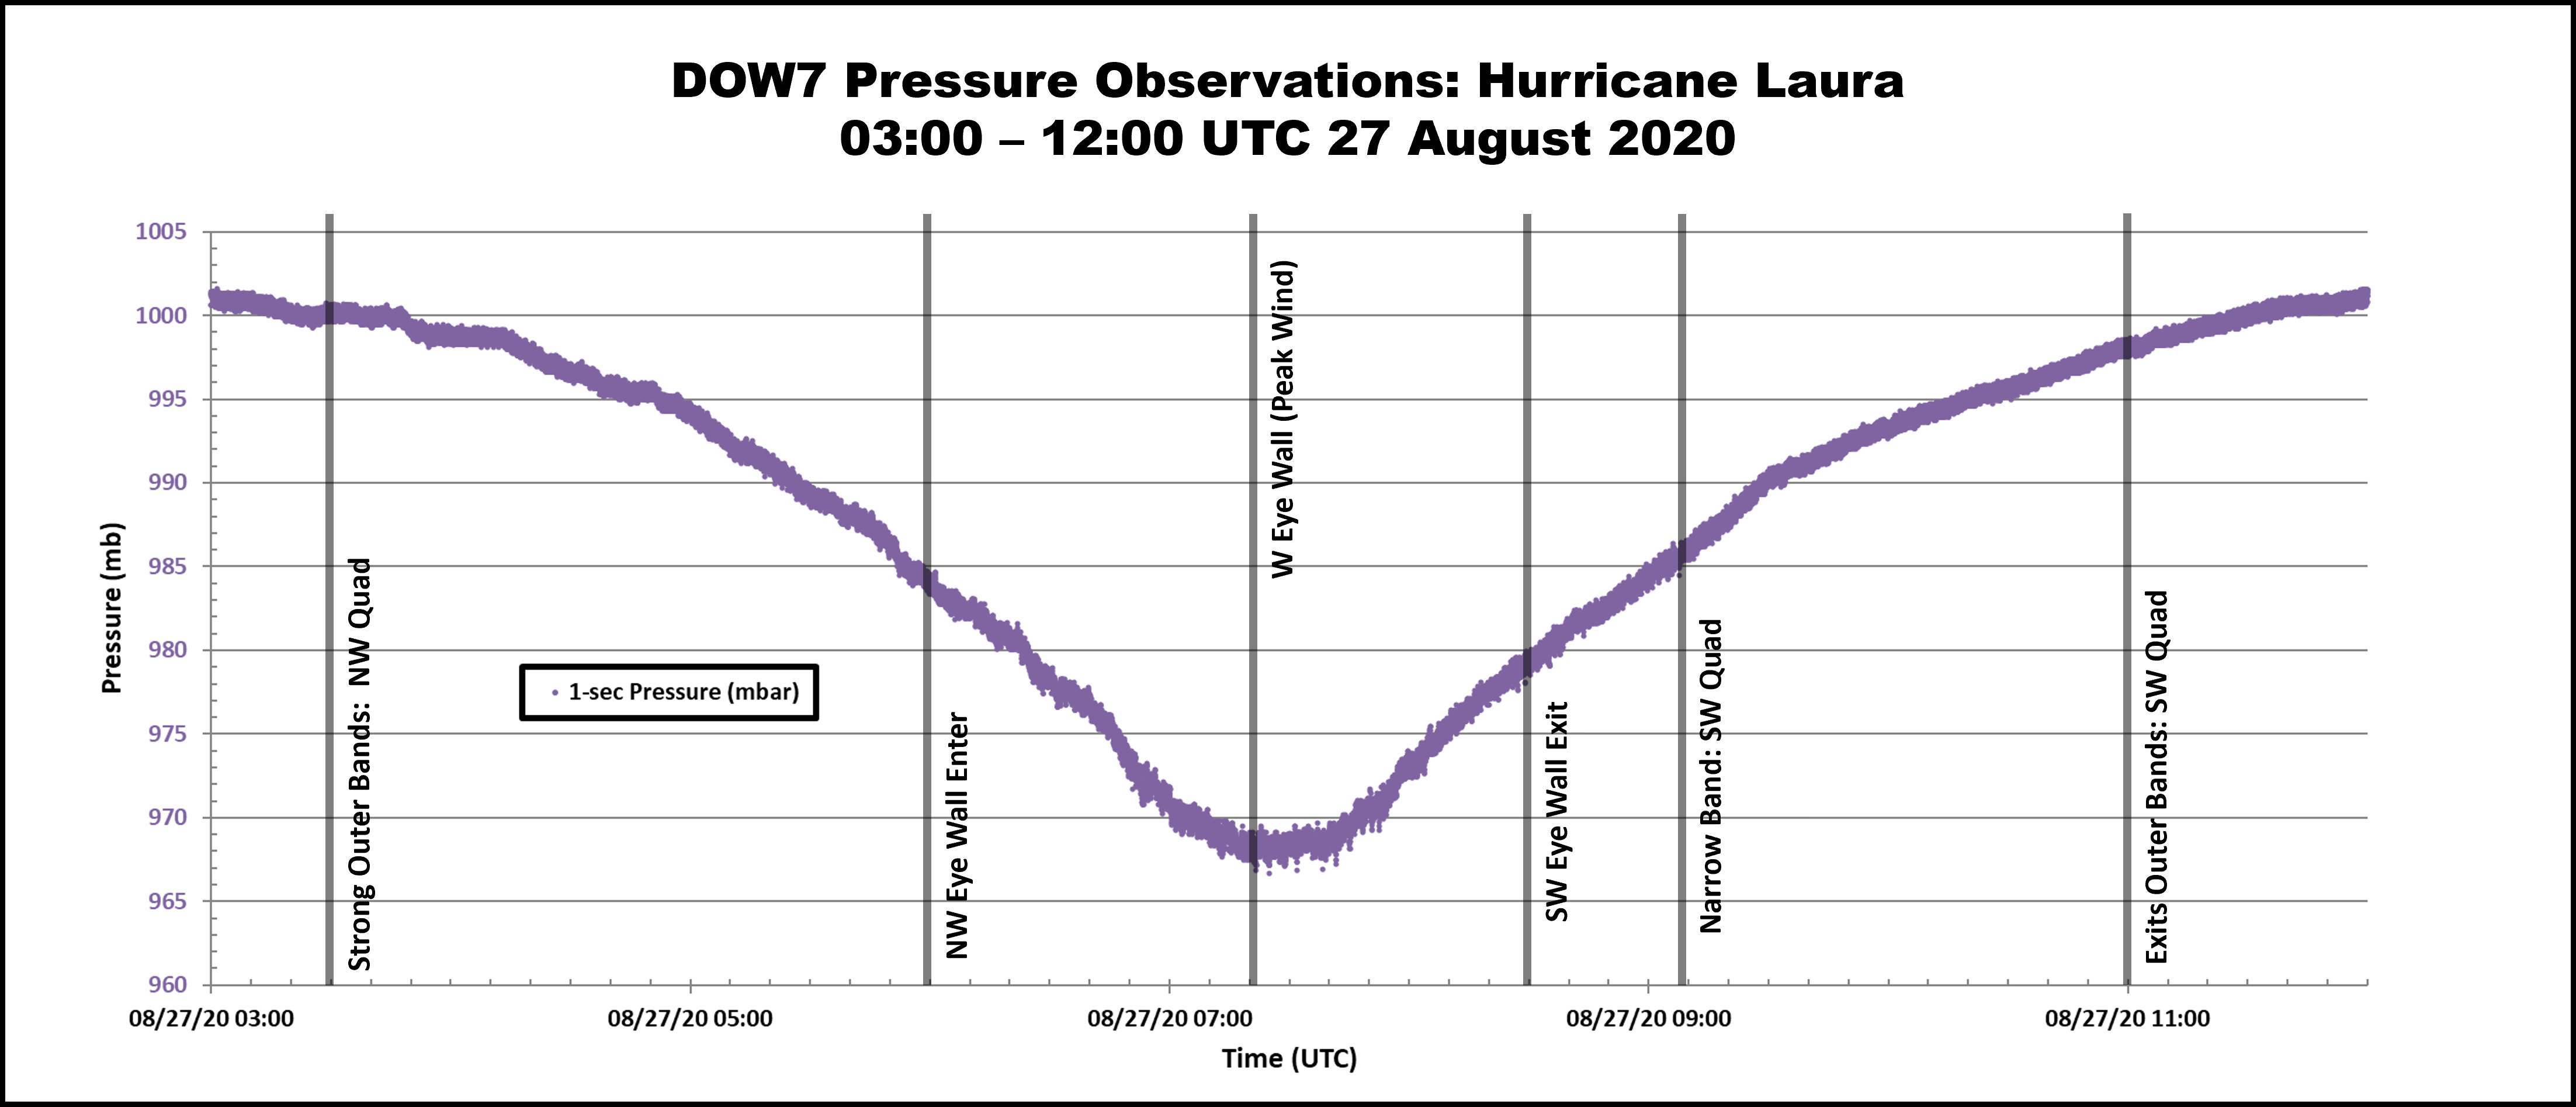
Observed atmospheric pressure from the DOW7 cabin during the passage of Hurricane Laura. Pressure was not corrected to sea level.
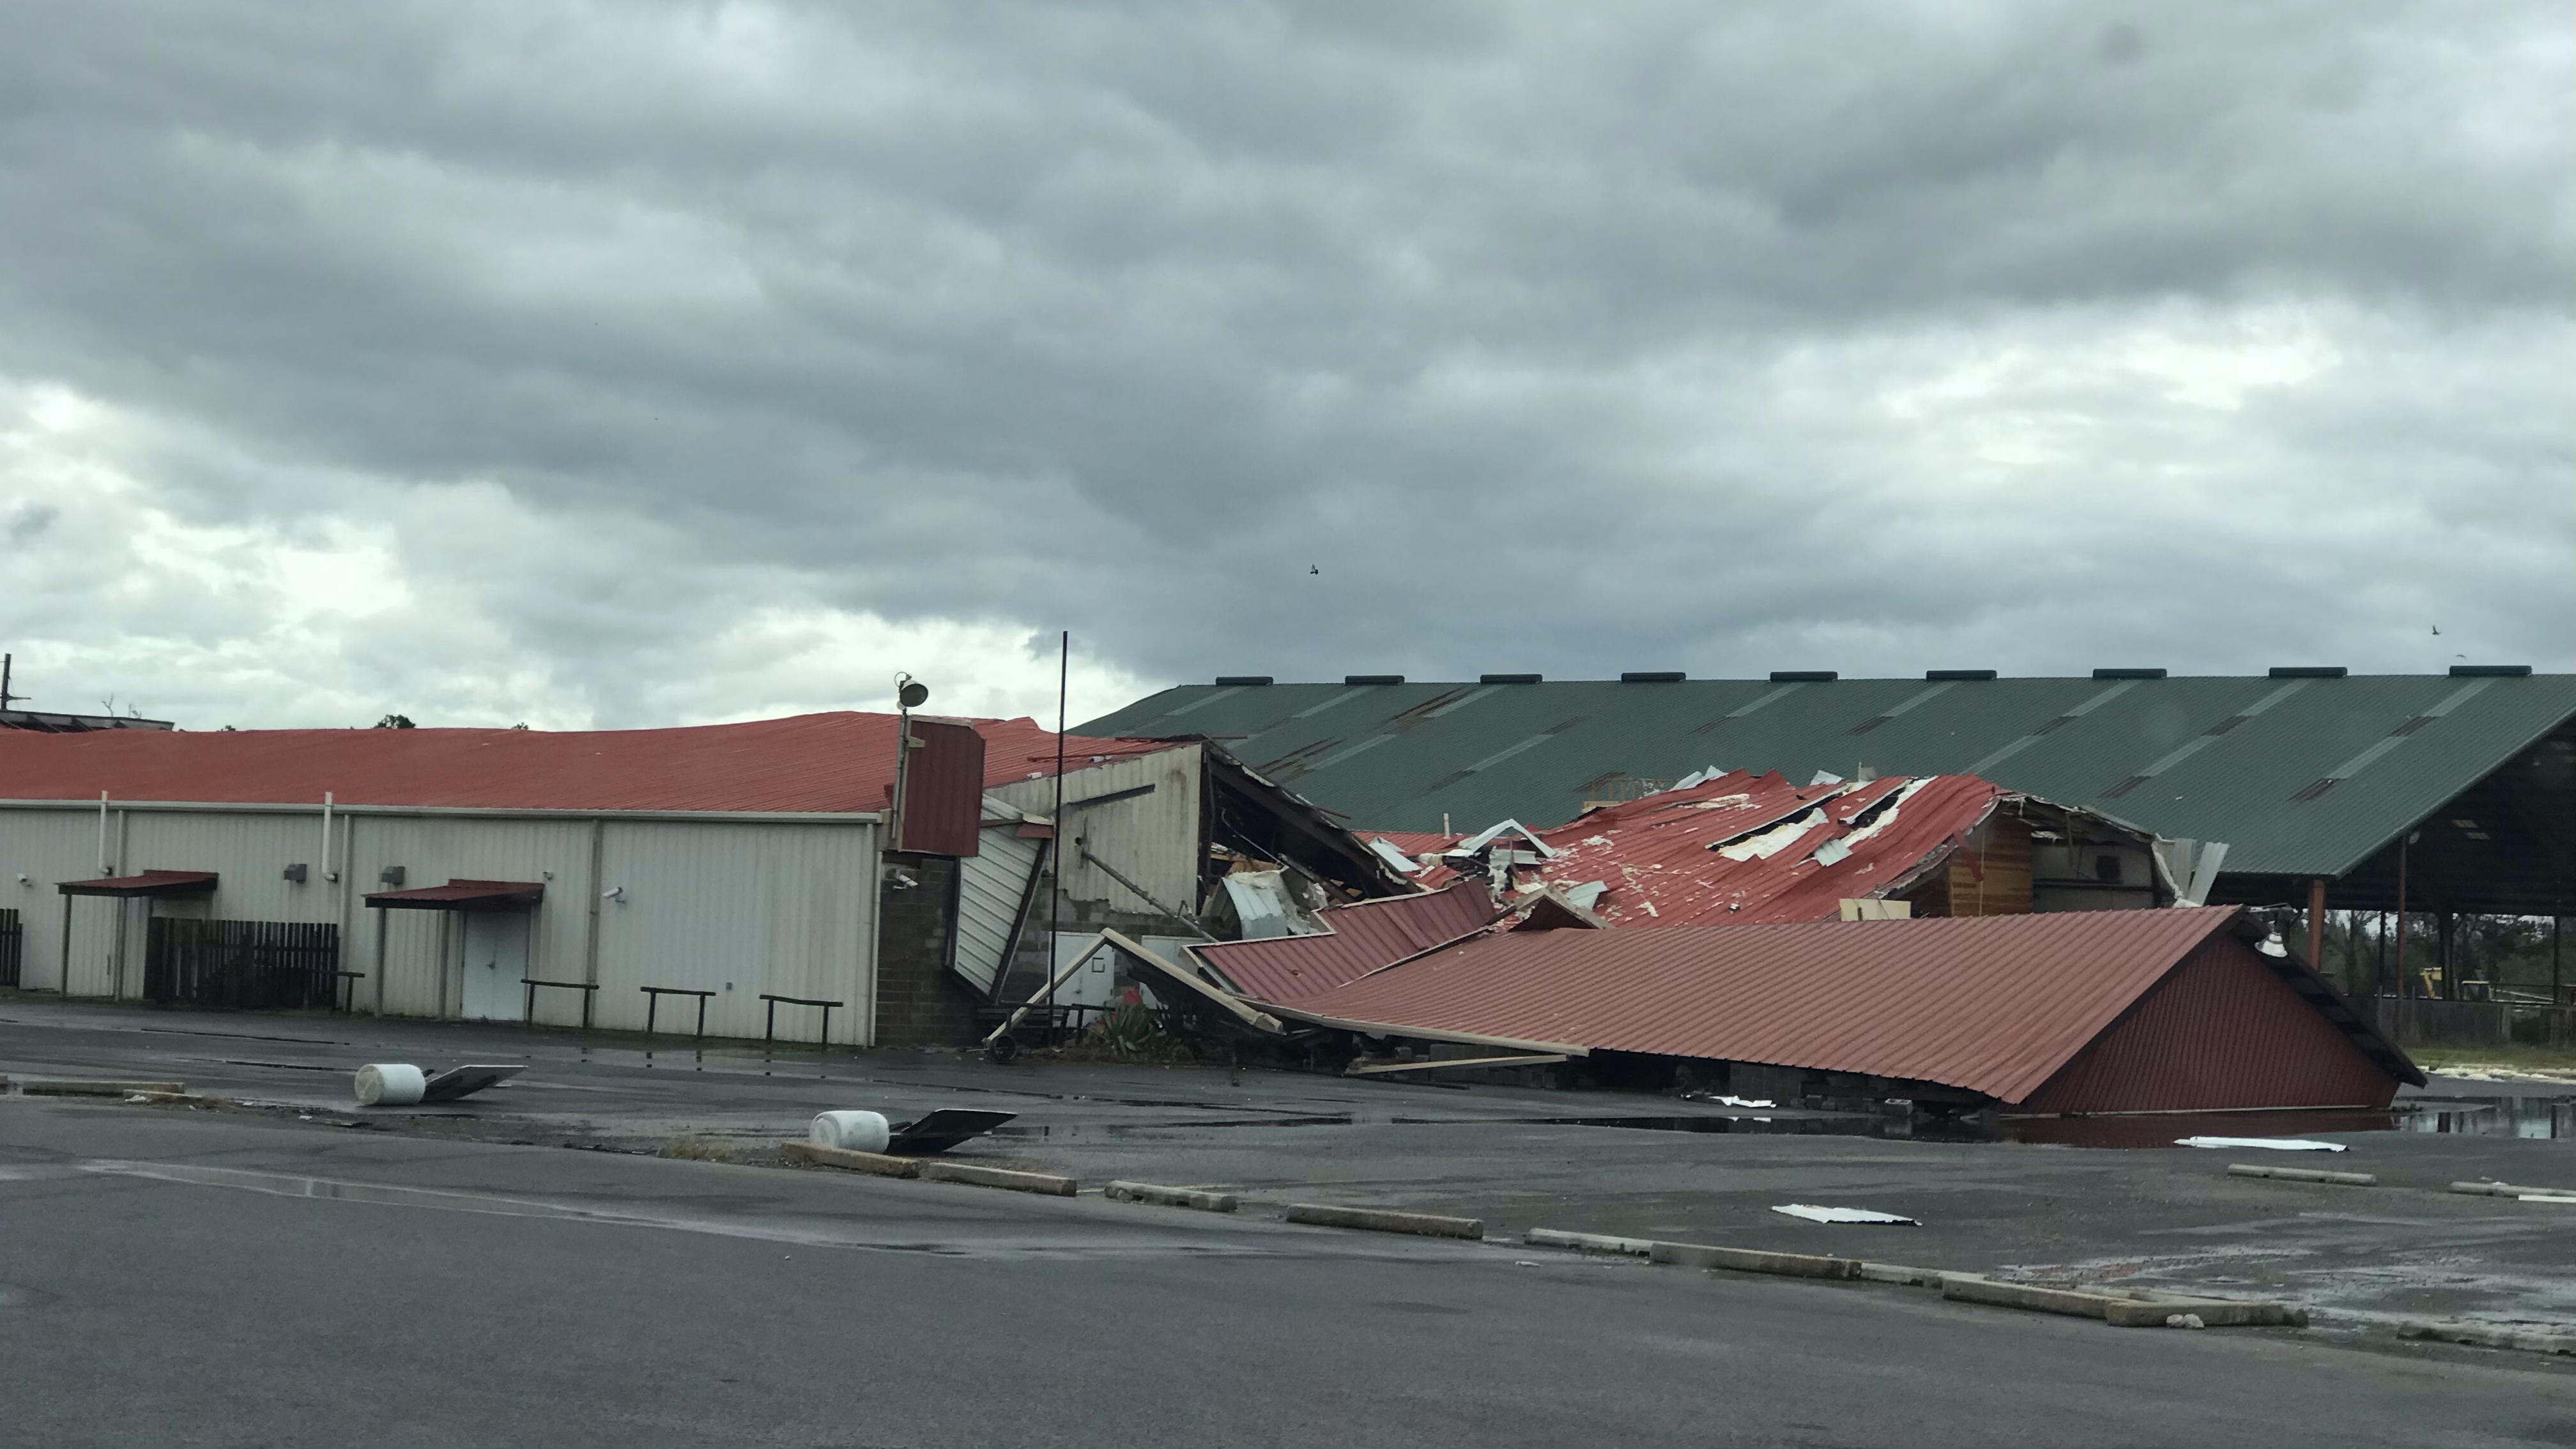
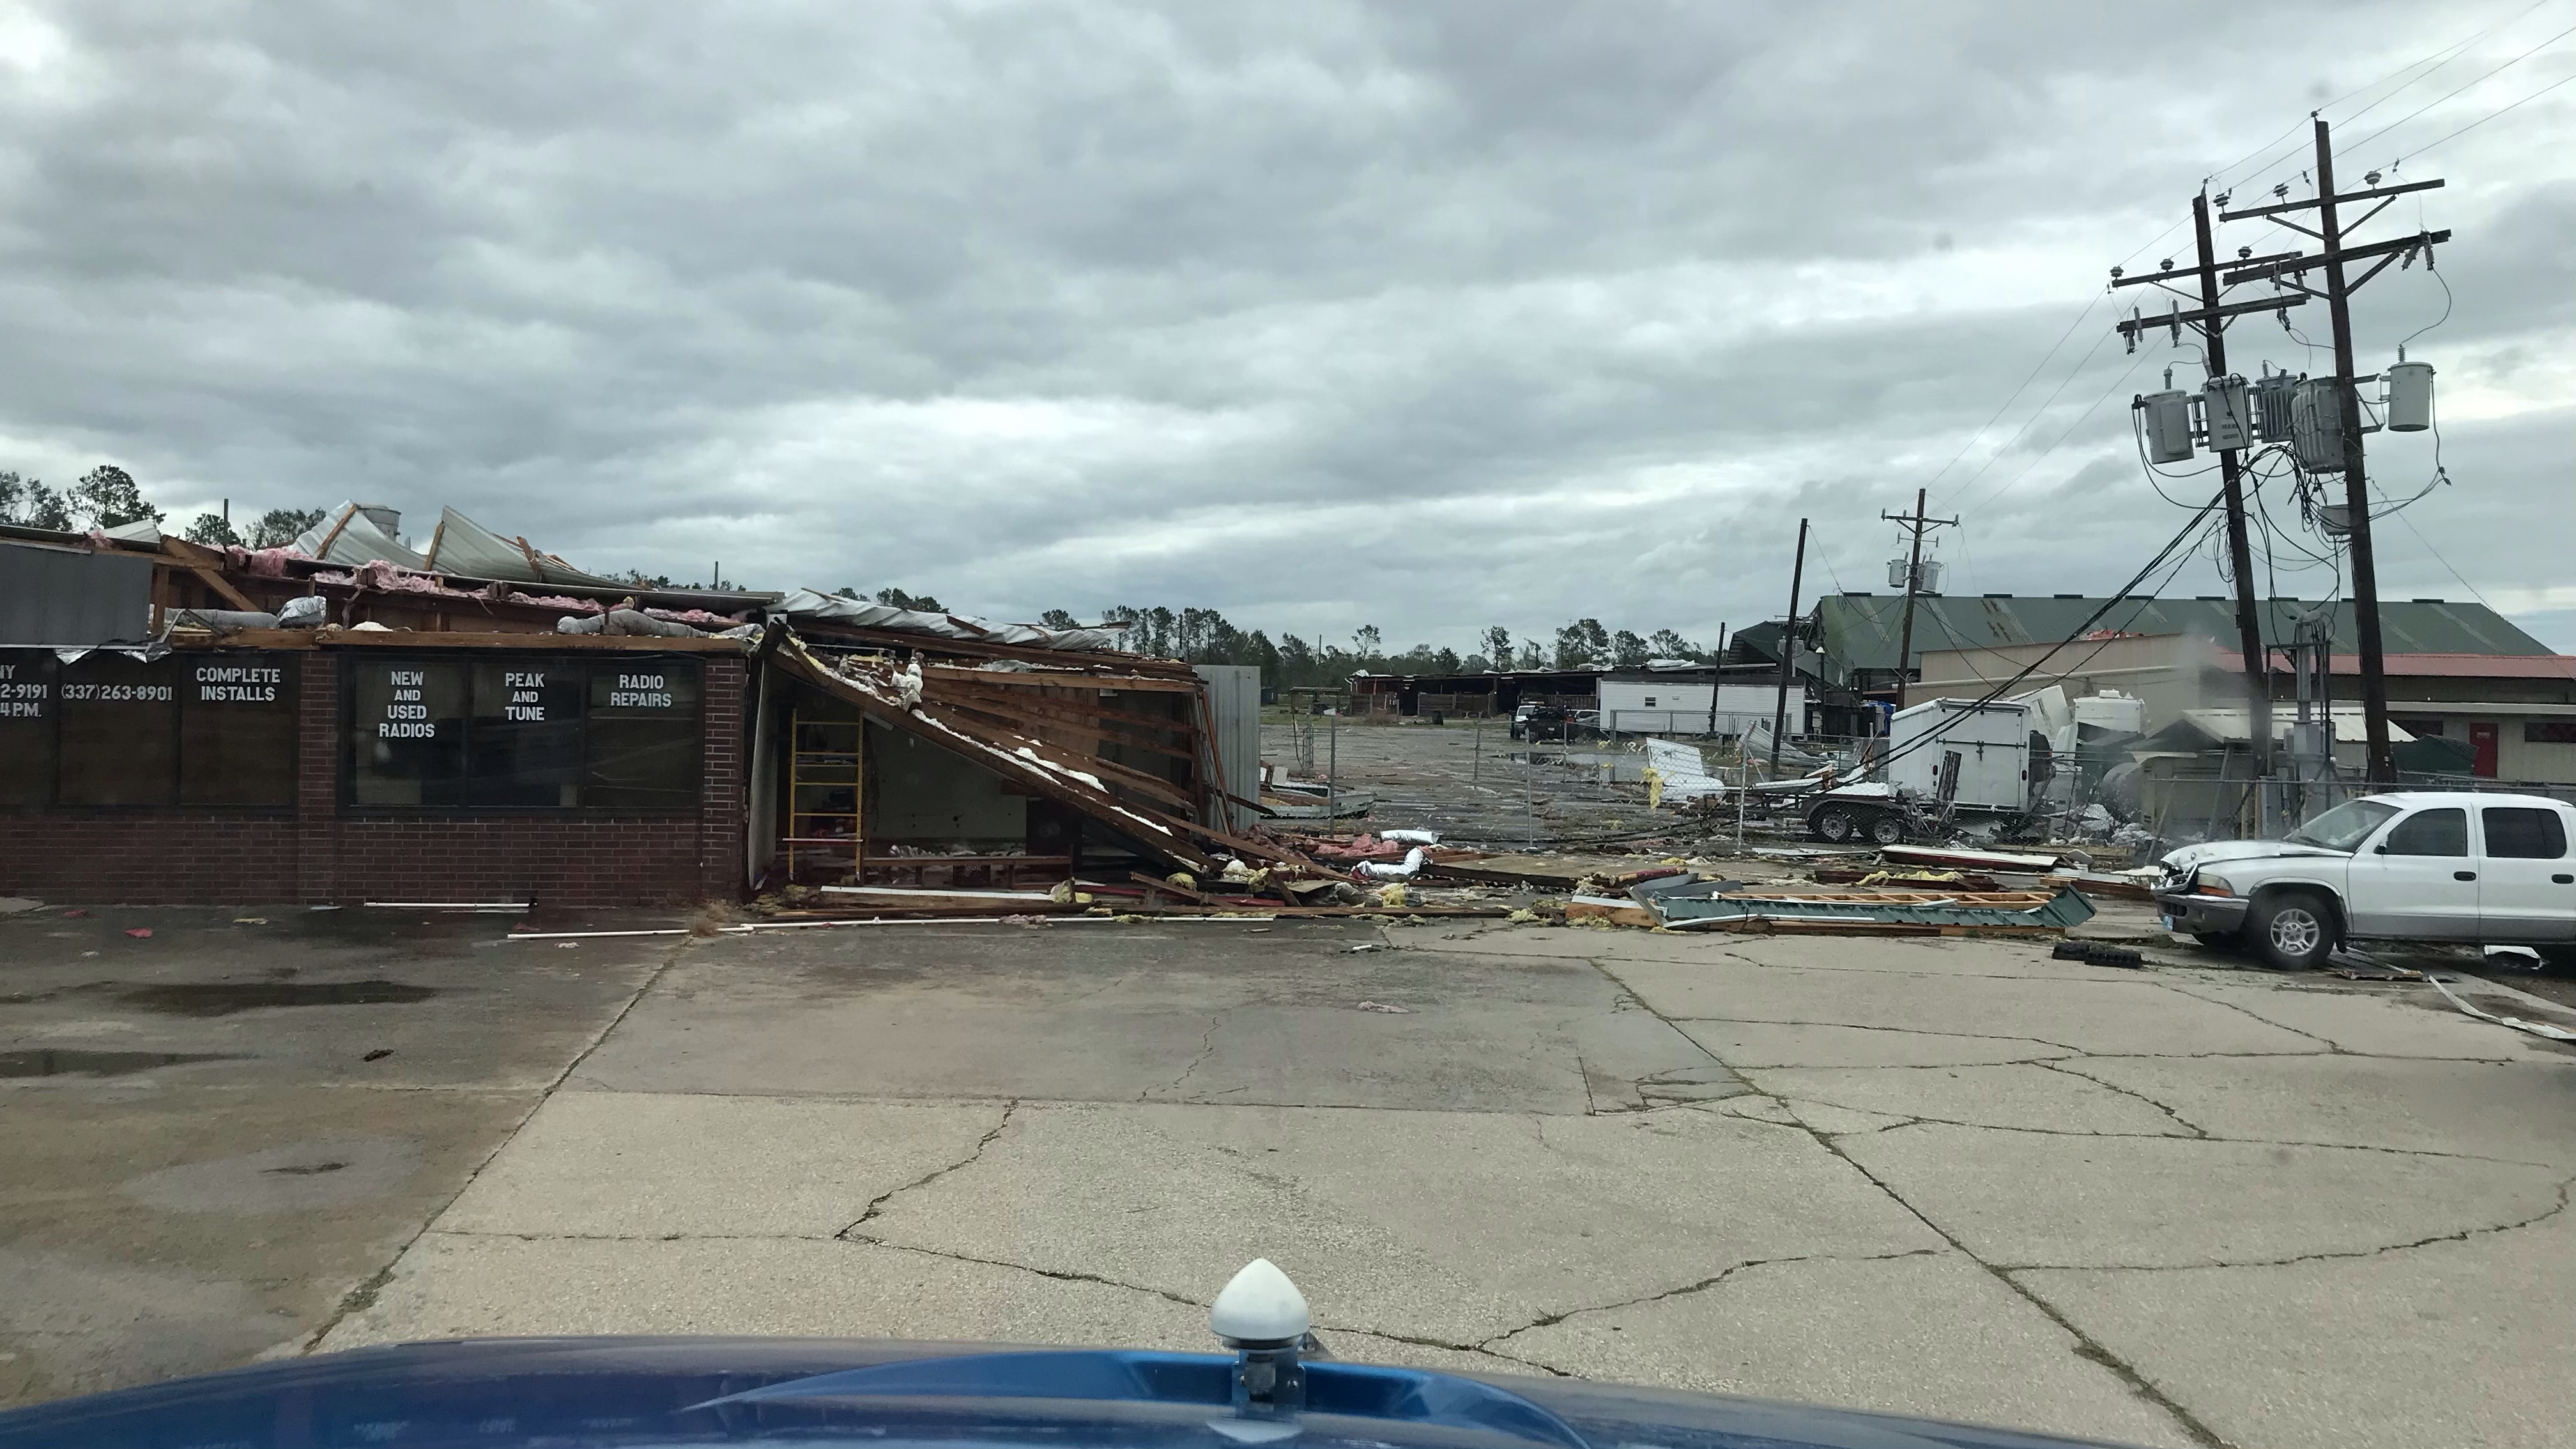
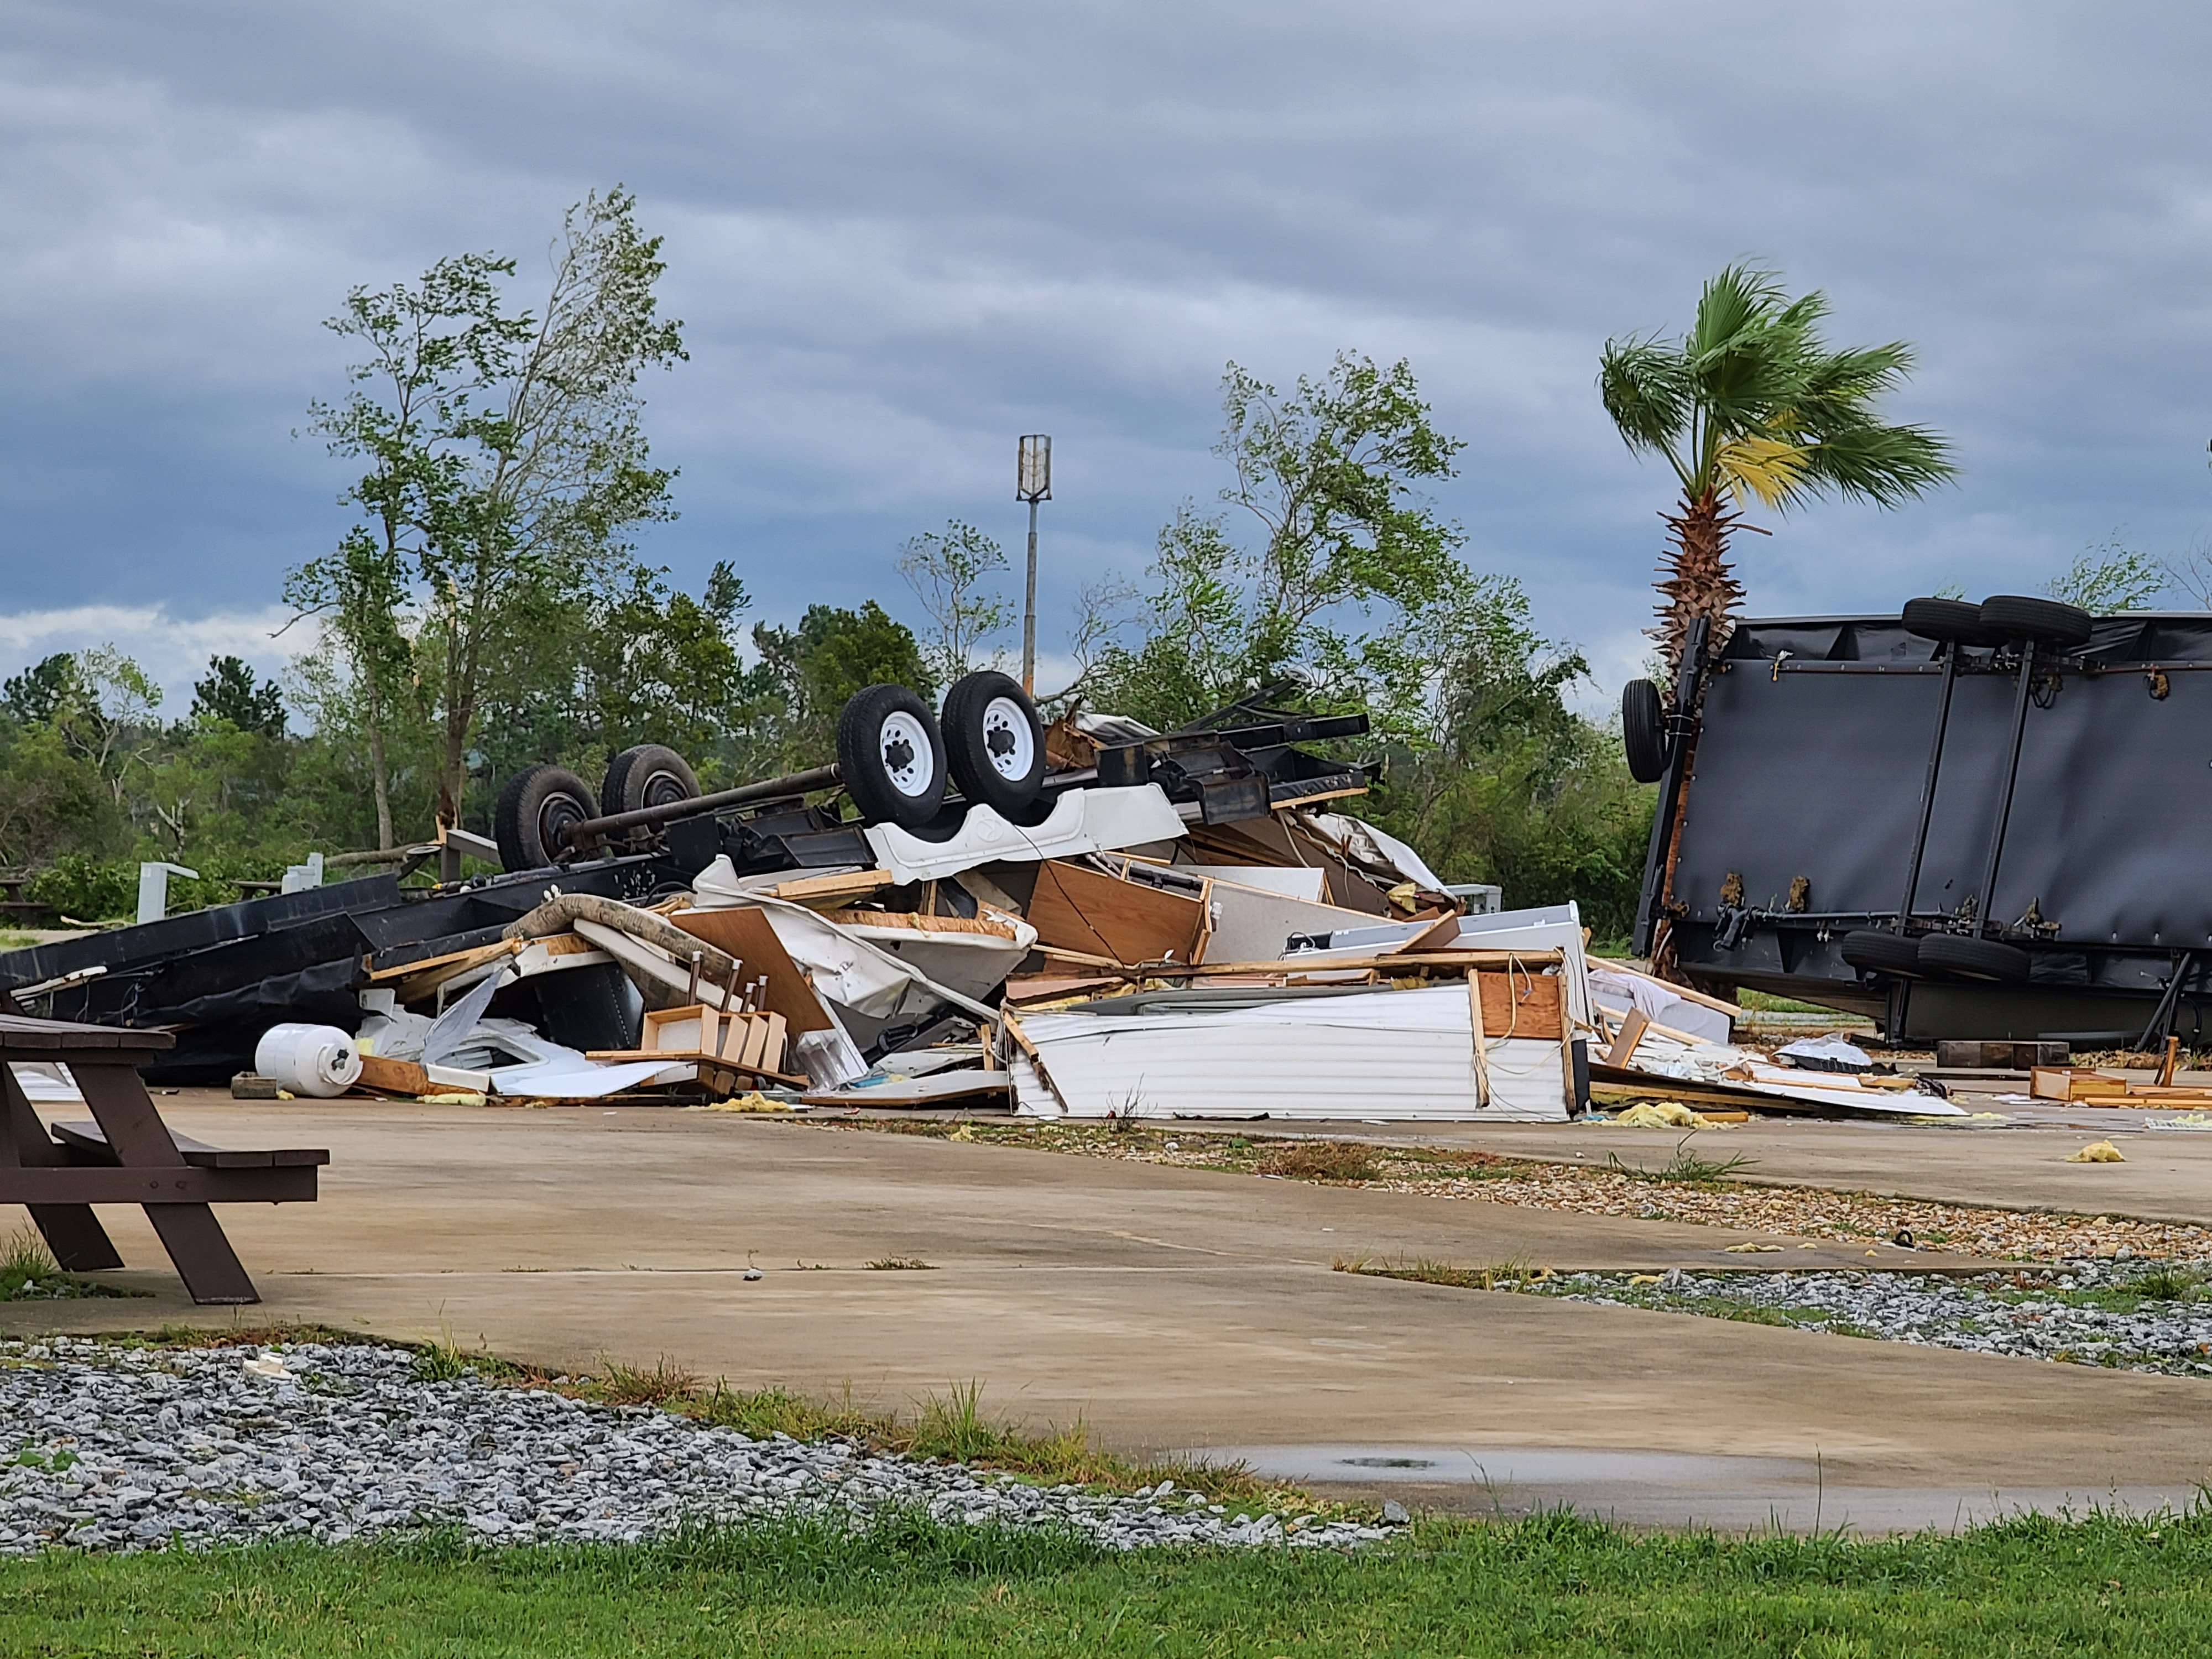
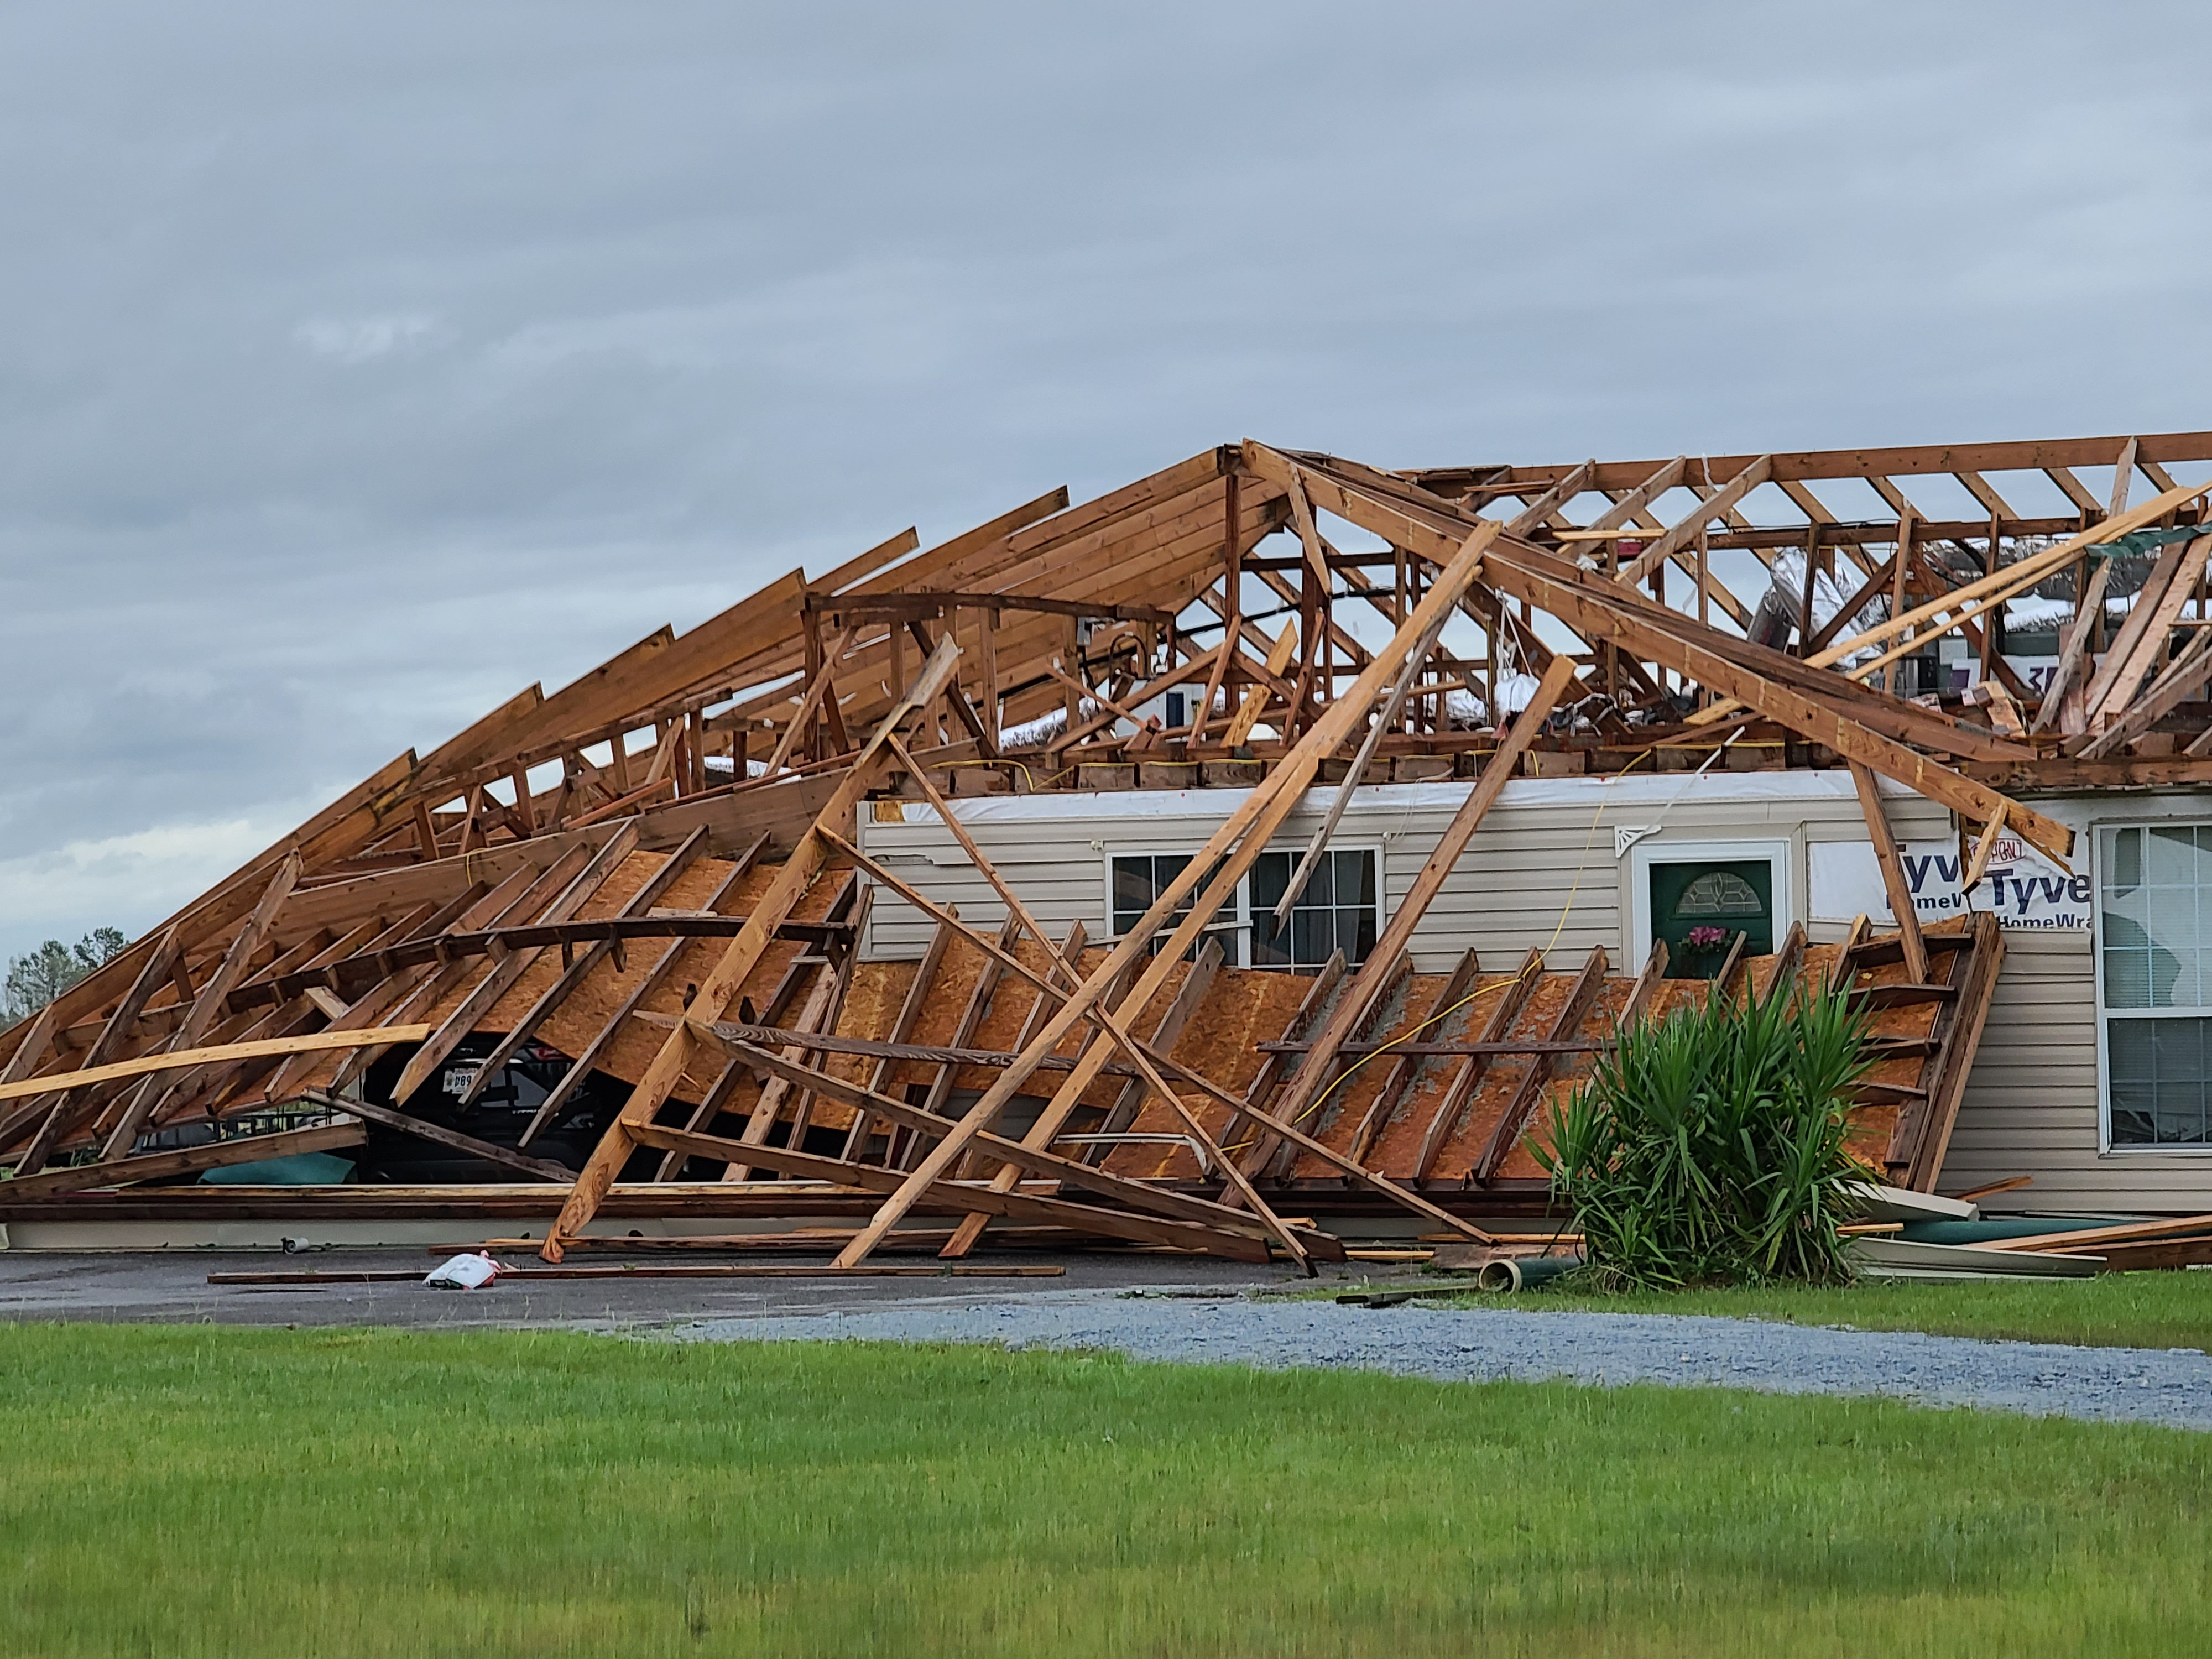
Damage in south-western Lousiana following Hurricane Laura.
Damage in south-western Lousiana following Hurricane Laura.
Damage in south-western Lousiana following Hurricane Laura.
Damage in south-western Lousiana following Hurricane Laura.
❮
❯